
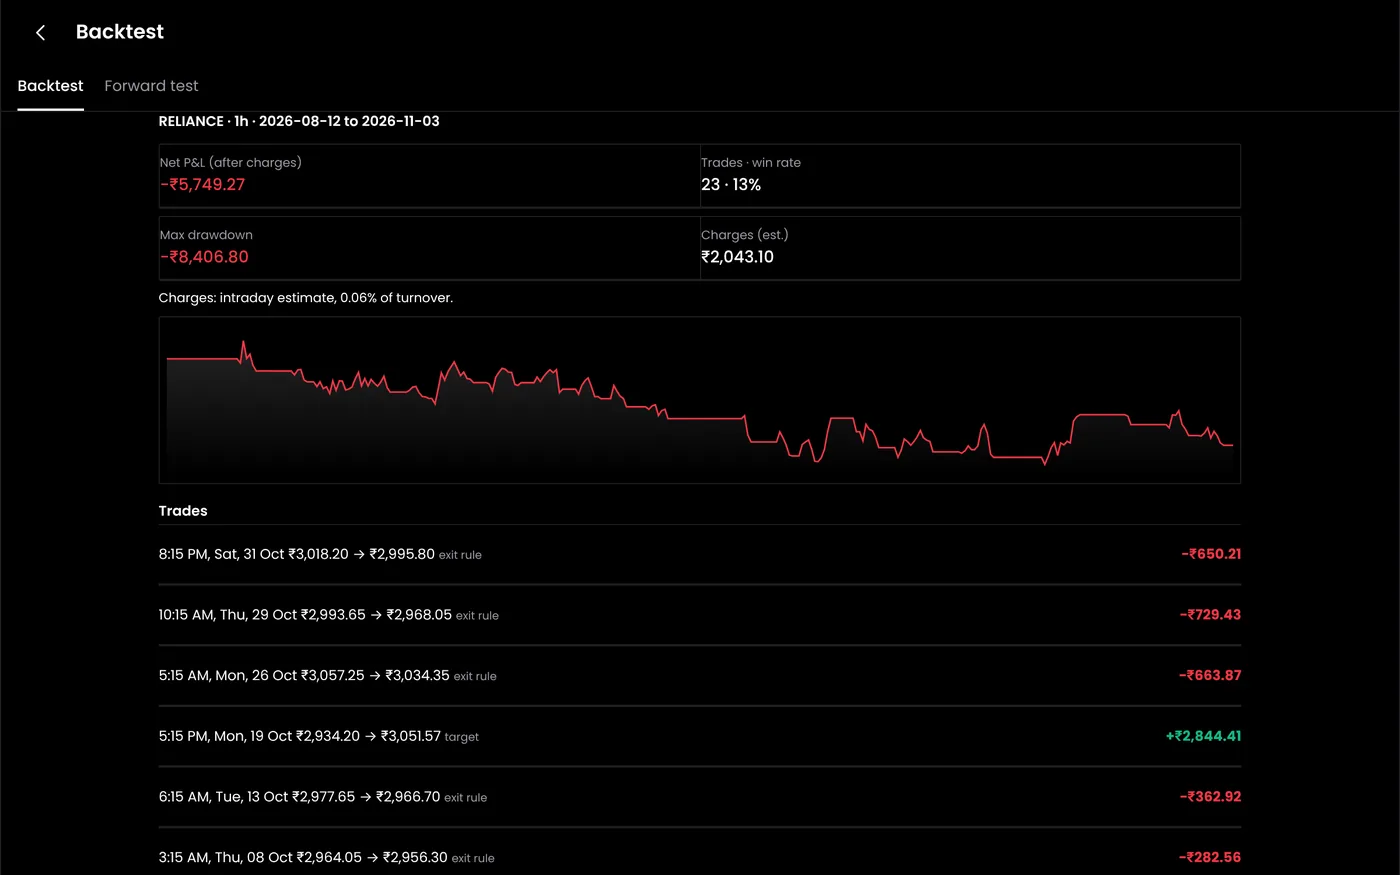
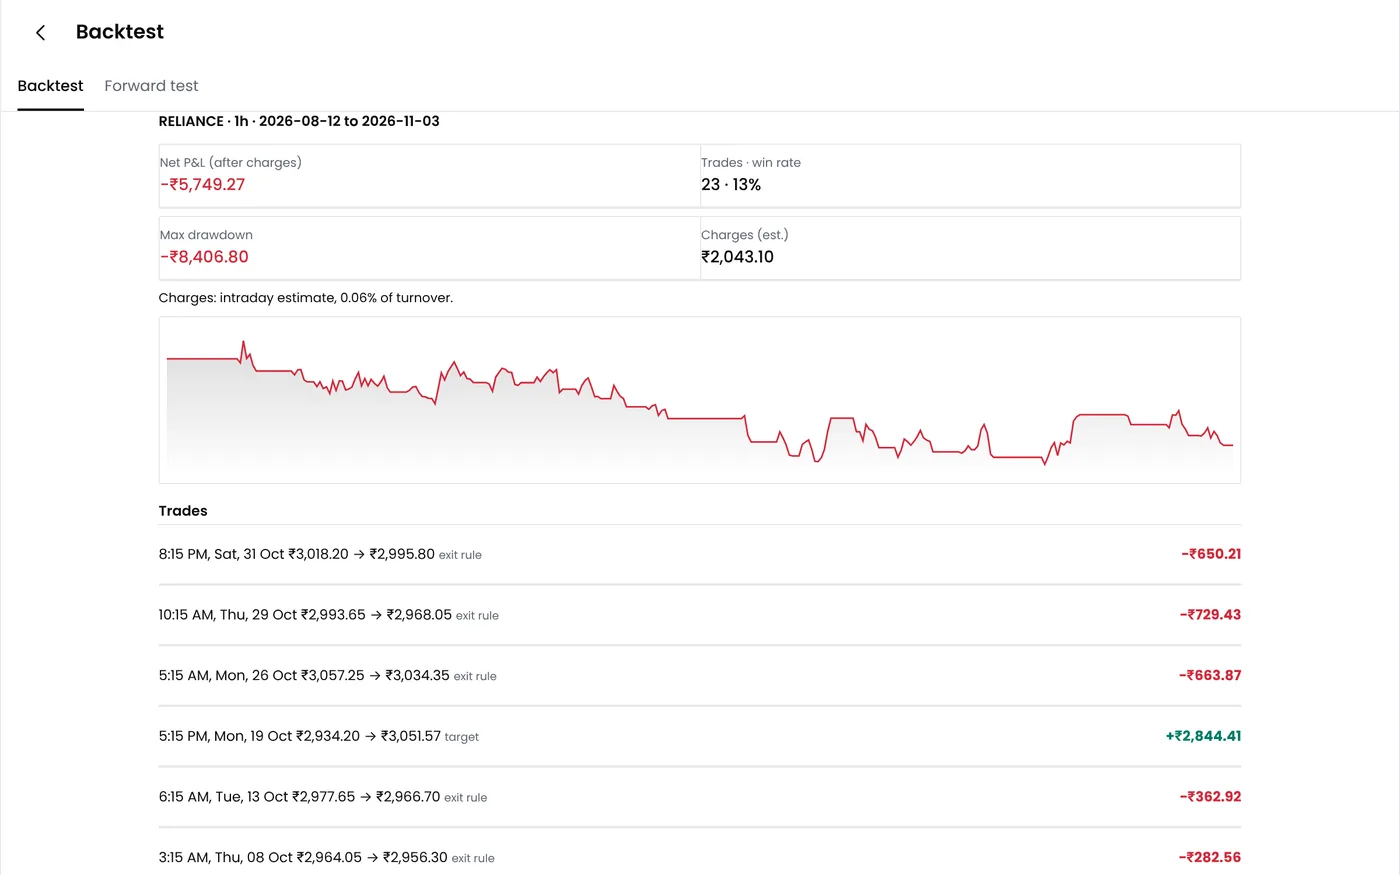
This guide is a step-by-step method for backtesting strategies on NSE data, from writing the rules to reading the results. It covers the details that decide whether a backtest can be trusted: realistic fills, every cost, contract changes, the right metrics and the tests that separate a real edge from luck. If you only need a definition, see backtest meaning.
Step 1: Start with a question
Every useful backtest answers a specific question. "Is option selling profitable?" is too vague to test. "Does selling the Nifty ATM straddle at 9:20 am, with a 25% stop loss on each leg and a 3:15 pm exit, make money after costs over the last three years?" can be tested.
A good question names:
- The instrument. Nifty weekly options, Bank Nifty futures, a basket of Nifty 50 stocks.
- The idea. Why should this work? Time decay, a tendency for breakouts to continue, mean reversion toward VWAP.
- The test period. Long enough to include calm and volatile markets.
- What success looks like. A net profit after costs, a maximum drawdown you could live with, a minimum number of trades.
Writing down why the strategy should work matters more than it seems. A strategy with a clear reason behind it is more likely to keep working than one found by trying combinations until something looks good.
Step 2: Write the rules before you see any results
Write the complete rule set first, then run the test. If you change the rules after seeing the results, you are fitting them to the past.
Every rule must be exact enough for a computer to follow:
| Component | Vague | Exact |
|---|---|---|
| Entry | When the market looks strong | When a 5-minute candle closes above the 9:15–9:30 high |
| Size | A few lots | 1 lot of 65 units |
| Stop loss | If it goes wrong | At the 9:15–9:30 low |
| Target | When it has moved enough | 1.5 times the opening range |
| Time exit | Before the close | 3:15 pm |
| Filters | Avoid bad days | Skip RBI policy and Budget days |
If a rule needs judgement, it cannot be tested reliably. Either make it exact or remove it.
Step 3: Get the right data
The data decides what a backtest can tell you.
Match the data to the strategy
Intraday strategies need intraday data, usually 1-minute candles or tick data. A strategy with a stop loss that can trigger within a candle needs data fine enough to know when it would have triggered. Positional strategies can use daily data, but only if entries and exits happen at prices you could actually have traded.
Options need data for each contract
Options strategies need prices for each strike and expiry, not just the index. To test a short straddle you need the price of the exact call and put you would have sold at 9:20 am on each day, and their prices every minute after that until you exit.
Account for contract changes
Indian derivatives have changed a great deal in recent years, and a backtest that spans those changes must handle them:
- Lot sizes. NSE has changed the Nifty lot size several times. The most recent change cut it from 75 to 65 units from the January 2026 series. Rupee results must use the lot size in force on each date.
- Weekly expiries. Since November 2024, NSE has offered weekly options only on Nifty 50, and BSE only on Sensex. A Bank Nifty weekly strategy cannot be tested beyond that date because the contracts no longer exist.
- Expiry days. Exchanges have moved expiry days more than once. Use the actual expiry date of each contract.
- Margins and charges. SEBI's framework added extra margin on expiry day for short index options, and transaction taxes have changed over time.
Watch for survivorship bias and corporate actions
For stock strategies, use data that includes stocks that were later delisted or removed from an index. Testing only today's Nifty 50 members on ten years of data quietly removes the companies that failed, which flatters the results. Adjust prices for splits, bonuses and dividends so that a corporate action does not look like a crash or a rally.
Step 4: Model fills honestly
Most backtests that look too good get their fills wrong.
Trade at prices you could have traded
A signal that appears when a candle closes can only be traded after it closes. Suppose a 5-minute candle closes at ₹500.00 and triggers a buy of 80 shares. A naive backtest buys at ₹500.00. In reality, the next price available is the next candle's open, say ₹500.40. If the trade exits at ₹503.10:
- Naive backtest: 80 × ₹3.10 = ₹248 gross profit.
- Realistic backtest: 80 × ₹2.70 = ₹216 gross, minus ₹46 of charges, for ₹170 net.
The naive version overstates the result by about 46%. Over hundreds of trades, that gap decides whether a strategy is profitable.
Decide what happens when a candle hits both the stop and the target
Suppose you are long with a stop at ₹98 and a target at ₹104, and the next candle has a high of ₹105 and a low of ₹97. Both levels were touched, but the candle does not tell you which came first. A backtest that assumes the target was hit first will be optimistic. The safe assumption is that the stop was hit first, or to use finer data to find out.
Account for depth and spreads
A backtest that fills a large order at the last traded price ignores the order book. If you buy 100 units and only 20 are offered at ₹100 with the next 80 at ₹101, your average price is ₹100.80. A single-price fill at ₹100 understates the cost by ₹80. Options, especially far out-of-the-money strikes, often have wide bid-ask spreads. Buy at the ask and sell at the bid in your backtest, or add a slippage allowance for every order.
Step 5: Include every cost
Costs are certain; profits are not. Include all of them:
- Brokerage on every order
- Securities transaction tax (STT)
- Exchange transaction charges and SEBI fees
- Stamp duty and GST
- Slippage between the expected price and the fill
- Platform and data subscriptions
Here is how they add up. A strategy makes ₹18,000 gross over 100 round trips in a year. Charges total ₹6,000 and slippage another ₹4,000, leaving ₹8,000. A ₹3,000 software subscription leaves ₹5,000. The strategy kept less than a third of its gross profit, and a little more slippage would have wiped it out.

Estimate charges with the brokerage calculator and the STT tax calculator, and model slippage with the slippage calculator.
Step 6: Model capital and position size
Decide how much capital the strategy uses and how the position size is set.
- Start with fixed size. Test with one lot or a fixed number of shares first. Compounding makes results harder to read, because a lucky early run inflates every later trade.
- Check margin. Options and futures need margin, and margin rises on volatile days and on expiry day. A strategy that runs out of margin on its worst day cannot follow its own rules.
- Round to whole lots. Real positions come in lots. A sizing rule that asks for 2.7 lots must round down to two.
- Size by risk. Once the strategy works at fixed size, size each trade by the loss you can accept, using the position size calculator.
Step 7: Read the right metrics
Total profit is the least informative number in a backtest. Look at the full picture:
| Metric | What it tells you | What to watch for |
|---|---|---|
| Net profit after costs | Whether the strategy made money | Compare with the risk taken |
| Number of trades | How much evidence the result rests on | Fewer than 100 trades is thin |
| Win rate | How often trades made money | Meaningless on its own |
| Average win and average loss | The size of typical outcomes | Large average losses with a high win rate |
| Expectancy | Average profit per trade after costs | Must stay positive after realistic costs |
| Profit factor | Gross profits divided by gross losses | Close to 1 means little margin for error |
| Maximum drawdown | The largest fall from a peak | Could you live through it? |
| Time to recover | How long the worst drawdown lasted | Months underwater test patience |
| Longest losing streak | The worst run of consecutive losses | Plan your sizing around it |
| Sharpe and Sortino ratios | Return relative to volatility | Compare strategies on the same basis |
Expectancy
Expectancy combines win rate and the size of wins and losses. Suppose 40% of trades win an average of ₹300 and 60% lose an average of ₹150:
0.40 × ₹300 − 0.60 × ₹150 = ₹120 − ₹90 = ₹30 per trade.
That looks positive. But if costs average ₹35 per trade, expectancy is −₹5 and the strategy loses money over time. Always calculate expectancy after costs.
Drawdown and recovery
Drawdowns are harder to recover from than they look. A 30% fall needs a gain of about 43% to get back to the peak, because the recovery starts from a smaller base. Measure the largest drawdown with the max drawdown calculator, and compare risk-adjusted returns with the Sharpe ratio calculator.
Step 8: Test whether the result is real
A good-looking backtest is a hypothesis, not proof. These tests check whether the edge is likely to survive.
Check parameter stability
Run the strategy with nearby settings. If a straddle works with a 9:20 entry and a 25% stop, it should also work reasonably well with a 9:30 entry or a 30% stop. If only one exact combination works and its neighbours fail, the result is probably luck.
Separate design data from test data
Split your history. Design and tune the strategy on one period, then test it once on a later period it has never seen. If the results collapse on the unseen period, the strategy was fitted to the past. Our guide to avoiding overfitting covers this in depth.
Use walk-forward testing
Walk-forward testing repeats that split over time. Design on 2021 to 2023 and test on 2024, then design on 2022 to 2024 and test on 2025, and so on. The combined results of the test periods are a much fairer estimate of live performance than a single backtest. See walk-forward testing.
Count how many versions you tried
The more variations you test, the more likely the best one is luck. Researchers have shown that with five years of daily data, trying more than about 45 independent strategy variations is almost guaranteed to produce one with an attractive in-sample Sharpe ratio even if none of them has any real edge. Keep a record of every version you test and be most suspicious of the best one.
Stress-test the order of trades
A Monte Carlo simulation reshuffles the order of your trades thousands of times to show the range of drawdowns the same trades could have produced. The historical order is only one of many possible paths. Our guide to Monte Carlo simulation explains how to run one.
Check different market conditions
Look at how the strategy did in specific periods: the March 2020 crash, steadily trending years, quiet range-bound months and sudden event days. A strategy that made all its money in one kind of market may stop working when conditions change.
Step 9: Forward test before going live
Once the backtest holds up, run the strategy on live prices without real money. Paper trading shows how the strategy behaves in today's market, how its orders fill and whether anything in the logic breaks.
Compare paper results with the backtest over the same kind of period. Large differences usually point to unrealistic fills or costs in the backtest. Our comparison of backtesting and forward testing explains what each can and cannot tell you.
Step 10: Go live small and keep checking
Start with the smallest size the strategy allows and a daily loss limit. Track live results against the backtest and the paper trades. Expect live results to be somewhat worse; if they are much worse, stop and find out why before adding size.
Backtesting options strategies
Options add a few challenges of their own:
- Define ATM at the entry time. The at-the-money strike at 9:20 am is the strike nearest to the index at 9:20 am, not at the open or the previous close.
- Track each leg separately. Per-leg stops, re-entries and adjustments must be modelled on each option's own price path.
- Model changes in IV. Option prices move with implied volatility as well as the index. Using real option prices rather than prices calculated from the index captures this automatically.
- Handle expiry correctly. Options settle at the final settlement price. A strategy that holds to expiry must use it, and one that exits before must use the price at the exit time.
- Watch margin through the day. Margin for short options can rise sharply during volatile sessions and on expiry day.
- Use enough expiries. A weekly strategy over three years gives around 150 expiries. A monthly strategy over the same period gives only 36, which is thin evidence.
Common backtesting mistakes
- Look-ahead bias: using information that was not available at the time, such as the day's closing price to decide a morning entry. See look-ahead bias.
- Ignoring costs and slippage, especially for strategies that trade often.
- Filling at the signal price instead of the next available price.
- Testing on too few trades and treating the result as reliable.
- Optimising until the curve is smooth, then trusting the smoothest version.
- Using today's index members for a stock strategy tested over many years.
- Ignoring contract changes such as lot sizes, expiry days and discontinued weekly options.
Our list of common backtesting mistakes covers more.
Tools for backtesting
You can backtest in a spreadsheet, in Python or on a platform.
- Spreadsheets work for simple daily strategies but struggle with intraday options data and multi-leg positions.
- Python gives full control, but you must source clean data, model fills and costs yourself and maintain the code.
- A backtesting platform handles data, fills and costs for you, so you can focus on the rules.
The QuantPower backtesting engine runs strategies built in the no-code strategy builder over past Nifty, Bank Nifty and Sensex expiries, with costs included and every trade listed. The QuantPower backtest tutorial walks through your first test step by step.
Start your free trial
Connect your broker, build a strategy and test it on paper before a single live order goes out.
Frequently asked questions
How many years of data do I need for a backtest?
Enough to include different market conditions and at least 100 trades. For intraday options strategies, two to three years of weekly expiries is a reasonable minimum. For slower strategies, you may need much longer.
Is backtesting enough before trading live?
No. A backtest shows how rules would have performed in the past. Paper trading on live prices, then a small live start, are needed to check fills, costs and how the strategy behaves now.
Why are live results usually worse than backtests?
Because backtests often underestimate slippage and costs, use fills that were not really available and are tuned to past data. Markets also change after the test period.
What is a good win rate for a strategy?
There is no good win rate on its own. A strategy that wins 35% of the time can be very profitable if its wins are large, and one that wins 90% can lose money if its losses are large. Look at expectancy after costs.
What is the difference between backtesting and paper trading?
Backtesting replays past data quickly over a long period. Paper trading runs in real time on live prices with virtual money. Backtesting tests the idea; paper trading tests the execution.
Can I backtest options strategies without coding?
Yes. Platforms such as QuantPower let you build multi-leg options strategies with entries, stops and exits through menus, then backtest them over past expiries.
What is overfitting in backtesting?
Overfitting is tuning a strategy so closely to past data that it captures random noise rather than a real pattern. An overfitted strategy looks excellent in the backtest and fails on new data.
Sources
- Bailey, D. H., Borwein, J. M., López de Prado, M. and Zhu, Q. J. (2014). Pseudo-Mathematics and Financial Charlatanism: The Effects of Backtest Overfitting on Out-of-Sample Performance. Notices of the American Mathematical Society, 61(5), 458–471
- Bailey, Borwein, López de Prado and Zhu: The Probability of Backtest Overfitting
- NSE: Equity derivatives contract specifications
- SEBI circular SEBI/HO/MRD/TPD-1/P/CIR/2024/132: Measures to strengthen the equity index derivatives framework, 1 Oct 2024