
The moving average crossover strategy at a glance
| Item | Setting |
|---|---|
| Instrument | Nifty futures, or options on the same signal |
| Candles | Daily for swing trades; 15-minute for intraday versions |
| Averages | A fast and a slow EMA, such as 9 and 20 |
| Long entry | The fast average closes above the slow one |
| Short entry | The fast average closes below the slow one |
| Exit | The opposite cross, or a trailing stop |
| Initial stop | 1.5% from the entry on daily candles |
| Best market | Long, steady trends |
| Worst market | Sideways ranges and V-shaped turns |
Key takeaways
- A crossover is a trend signal that arrives after the turn. On the model series the 9/20 EMA pair crossed 7 sessions after the high and 11 sessions after the low.
- Faster pairs signal sooner and cross more often in ranges; slower pairs signal later and cross less.
- On the model series every two-average pair lost on its short and gained on its long. The losses came from the speed of the turn, not from the choice of averages.
- A single average crossed by the price reacts faster than any pair, and whipsaws more in sideways markets.
- Filters such as a minimum gap between the averages, ADX or a long-term average remove some false crosses and delay every true one.
How moving averages work, in brief
A simple moving average (SMA) is the average of the last N closes. An exponential moving average (EMA) puts more weight on recent closes: today's EMA = close × k + yesterday's EMA × (1 − k), with k = 2 ÷ (N + 1). The EMA reacts sooner to a change of direction, and the SMA turns only when the closes leaving its window are on the other side of the price. The calculations, weights and the lag of each type are worked through in the guide to moving averages.
The crossover rules
Two averages
- Long: buy one lot when the fast EMA closes above the slow EMA.
- Short: sell one lot when the fast EMA closes below the slow EMA.
- Reverse: each opposite cross closes the trade and opens one the other way.
- Initial stop: 1.5% from the entry price.
- Size: set from the rupee loss at the stop.
One average and the price
A simpler version uses the price as the fast line: buy when the close crosses above the 20-day EMA, sell when it crosses below. It reacts faster than any two-average pair and trades more often.
The golden cross and the death cross
The best-known crossover is the 50-day SMA crossing the 200-day SMA: a golden cross when the 50-day moves above, a death cross when it moves below. On a daily index chart it gives only a few signals a decade and is used more as a long-term trend gauge than as a trading rule. It needs about ten months of data before the 200-day average exists.
Common settings
| Pair | Speed | Typical use |
|---|---|---|
| 5 and 20 EMA | Fast | Short swings, intraday |
| 9 and 20 EMA | Fast | Swing trading on daily and 15-minute charts |
| 9 and 21 EMA | Fast | The same, with a slightly slower base |
| 10 and 30 EMA | Medium | Swing and positional trades |
| 20 and 50 EMA | Medium | Positional trades |
| 50 and 200 SMA | Slow | The golden cross; long-term trend |
The gap between the two periods matters as much as the periods themselves. When the fast and slow averages are close in length, such as 9 and 12, they move almost together and cross on small wiggles. When they are far apart, such as 9 and 50, the slow average acts as a trend filter and the fast one as the trigger. Most tested pairs keep the slow period two to four times the fast one.
The model Nifty series
The examples use a model series of 72 daily closes, a seeded random walk that is not market data. It rises to 25,500.00 on day 32, falls 5.26% to 24,158.55 on day 44 and recovers to 25,867.60 by day 72. The same series is used in the guides to moving averages, RSI, MACD and Bollinger Bands.
Seven crossover rules on the same series
| Rule | Short entry | Short exit | Short result | Long entry | Long open at day 72 |
|---|---|---|---|---|---|
| Close and 20-day EMA | Day 37 at 24,938.05 | Day 51 at 24,628.95 | +309.10 points | Day 51 | +1,238.65 points |
| 5 and 20 EMA | Day 38 at 24,723.15 | Day 53 at 24,898.00 | −174.85 points | Day 53 | +969.60 points |
| 9 and 20 EMA | Day 39 at 24,761.10 | Day 55 at 24,888.60 | −127.50 points | Day 55 | +979.00 points |
| 9 and 21 EMA | Day 40 at 24,622.45 | Day 55 at 24,888.60 | −266.15 points | Day 55 | +979.00 points |
| 10 and 30 EMA | Day 41 at 24,483.65 | Day 56 at 24,933.90 | −450.25 points | Day 56 | +933.70 points |
| 9 and 20 SMA | Day 41 at 24,483.65 | Day 55 at 24,888.60 | −404.95 points | Day 55 | +979.00 points |
| 10 and 30 SMA | Day 42 at 24,504.95 | Day 59 at 25,142.55 | −637.60 points | Day 59 | +725.05 points |
The pattern is the same for every two-average rule: the short came after much of the fall, the cover came after the rebound, and the short lost. The slower the pair, the later both signals and the larger the loss. The only rule that gained on the short was the fastest, the close crossing its 20-day EMA, because it went short on day 37 and covered on day 51, before the averages had turned.
This series has two sharp turns and no long sideways stretch once the averages exist, which favours fast rules. In a long range the order reverses: the fast rules cross again and again and lose a little each time, while the slow pairs stay out. One series cannot rank the pairs; a test over many years can.
A worked trade on Nifty futures
The 9 and 20 EMA rule, on one lot of Nifty futures of 65 units. The example treats the futures price as equal to the index and shows the mechanics, not a record of results.
- Day 39, closethe 9-day EMA, 25,039.36, closes below the 20-day EMA, 25,041.82, a gap of 2.46 points. Sell one lot at 24,761.10, seven sessions and 738.90 points below the high. Stop 1.5% above, at 25,132.52, a risk of ₹24,142.
- Day 44, closethe low, 24,158.55. The short is 602.55 points, or ₹39,166, in profit. Nothing in the rules marks the bottom.
- Day 52, closeNifty has rebounded to 24,799.05 and the short is now 37.95 points behind. The averages have not crossed: the 9-day EMA is 24,521.20 and the 20-day 24,603.56.
- Day 55, closethe 9-day EMA, 24,698.62, closes above the 20-day, 24,676.57. Buy two lots at 24,888.60: one closes the short for a loss of 127.50 points, ₹8,288, and one opens a long. New stop 1.5% below, at 24,515.27.
- Day 72, closeNifty at 25,867.60. The long is 979.00 points, or ₹63,635, in profit and still open.
- Costsabout ₹970 for each round trip in one lot of futures.
The short is the cost of the method. It was 602.55 points ahead at the low and closed 127.50 points behind, because the exit waited for the averages to cross back. The long is the reason for the method: it held through the whole recovery because nothing in the rules ended it.
Why crossovers struggle in sideways markets
When the market moves sideways, the fast average weaves around the slow one and every cross is a new trade. Each false cross loses a little: the move after it is too small to cover the stop or the costs before the next cross reverses it. On the model series the averages had not yet formed during the sideways start, but the close crossed its 9-day EMA seven times between day 10 and day 22, while the index moved between 24,620 and 24,979. A rule trading those crosses would have paid seven round trips of costs, about ₹6,800, on a market that went nowhere.
Filters that reduce whipsaws
| Filter | How it works | Effect on the model 9 and 20 EMA trades |
|---|---|---|
| Minimum gap | Act only when the fast average is at least 0.1% of the price past the slow one | Short on day 40 at 24,622.45; long on day 56 at 24,933.90 |
| Confirmation | Act only after the cross has held for two closes | Each signal one session later |
| ADX | Trade crosses only when ADX is above 20 to 25 | Removes crosses in quiet markets |
| Long-term trend | Longs only above a rising 200-day average, shorts only below a falling one | Keeps the rule on the side of the main trend |
| Higher timeframe | Take 15-minute crosses only in the direction of the daily cross | Fewer intraday trades against the trend |
On day 39 the averages crossed by only 2.46 points, and on day 55 by 22.05 points, so a 0.1% gap filter, about 25 points, delays each signal by a session. On this series that made the short a little worse and the long a little later. In a range, the same filter keeps the strategy out of the many crosses where the averages barely separate. Every filter trades earlier entries for fewer false ones.
Giving back open profit
At the low on day 44 the worked short was 602.55 points ahead, ₹39,166 on one lot. It closed on day 55 at 127.50 points behind, a loss of ₹8,288. It gave back 730.05 points, ₹47,453, while the averages slowly crossed back. That is not a failure of the rule but its nature: a crossover exits only after the trend has visibly turned.
Traders who find this hard to watch usually start overriding the rule, and overrides tend to come at the worst moments. The alternatives are a faster exit chosen and tested in advance, or scaling out of part of the position.
Scaling out of a crossover trade
A common plan closes half the position when the open gain equals the initial risk and lets the rest run on the opposite cross. On the model long from day 55 the initial risk was 373.33 points, so the first half would close on the first close at or above 25,261.93. That came on day 65, at 25,265.85, for 377.25 points on the half. The other half was still open on day 72, 979.00 points ahead.
Scaling out smooths the account and trims the best trades. It needs at least two lots, or two spreads, to split, and whether it helps depends on how often trades reach the first target and then reverse.
Exits
| Exit | How it works | On the model short from day 39 |
|---|---|---|
| Opposite cross | Close when the averages cross back | Day 55 at 24,888.60, −127.50 points |
| Close beyond the fast average | Close when the price closes back above the 9-day EMA | Day 50 at 24,505.45, +255.65 points |
| Trailing stop on closes | Close when the price closes above the highest close of the last 5 sessions | Day 49 at 24,332.45, +428.65 points |
| Fixed target | Close once the gain reaches the initial risk, 371.42 points | Day 43 at 24,289.10, +472.00 points |
Faster exits kept more of the model short's gain. On this series the long from day 55 never closed below its 9-day EMA or below the lowest close of the previous 5 sessions, so the faster exits would have held it as long as the opposite cross did. In a trend with deeper pullbacks they would close good trades early. Test exits on many trades, with the entry held fixed.
Crossovers on intraday charts
On 15-minute candles the same rules work with four changes:
- A session limit. Close every trade by 3:15 pm, whatever the averages say.
- No entries in the first 15 minutes. The opening gap can jump the price through both averages in one candle.
- A daily direction filter. Take 15-minute longs only while the daily 9-day EMA is above the 20-day, and shorts only while it is below.
- Smaller stops, larger cost share. An intraday stop of 0.4% to 0.6% is about 100 to 150 Nifty points, so the ₹970 round trip on futures, about 15 points, is a tenth or more of the risk on every trade.
A 20-period EMA on a 15-minute chart covers 5 hours, most of one session, and carries the previous afternoon into the next morning.
Why the lag is the price of the method
A two-average crossover cannot happen until the fast average has travelled all the way across the slow one. After a V-shaped turn, that takes roughly as long as the slow average needs to stop falling and the fast one to climb past it. On the model series the 9 and 20 EMA pair crossed 11 sessions after the low, by which time Nifty had recovered 730.05 points of its 1,341.45-point fall. Shorter averages cut the delay and add false crosses; longer ones do the reverse. No setting removes the delay, because it comes from averaging itself.
Crossovers on Bank Nifty and stocks
The rules are the same on any instrument, but the stops and sizes differ. A 1.5% stop on Bank Nifty near 56,000 is about 840 points, ₹25,200 on one lot of 30, close to the rupee risk of a Nifty lot at the same percentage. Stocks gap on results and news, which can jump through a stop, and stock futures held to expiry settle by delivery of shares, so close or roll them before the expiry week. Use adjusted prices around splits and bonus issues, or the averages will cross on a price change that was not a move.
Crossovers and MACD
MACD is itself a crossover system. Its zero line is the 12-day EMA crossing the 26-day EMA, and its signal-line cross is a crossover of the gap between them with its own 9-day average, which turns sooner. On the model series MACD's signal-line crosses came on days 37 and 52, two and three sessions before the 9 and 20 EMA crosses on days 39 and 55. Using both in one rule adds little: they are built from the same closes and mostly agree.
Long-only and long-short versions
A long-only version buys on the bullish cross and goes flat on the bearish one. On the model series it would have avoided the losing short and taken the same long from day 55. Index markets have tended to rise over long periods, so long-only crossover rules on Nifty give up fewer good trades than they would in a market with no long-term drift. The short side still matters for hedging and for bearish option strategies.
Trading the signal with options
Crossover trades last weeks, so monthly expiries suit them. Model values with Nifty at 25,000, 30 days to expiry and IV of 14%, per lot of 65:
| Signal | Option position | Cost | Most it can lose | Most it can make |
|---|---|---|---|---|
| Bullish cross | Long 25,000 call at ₹469.35 | ₹30,508 | ₹30,508 | Unlimited |
| Bullish cross | Bull call spread, 25,000 and 25,500 calls, debit ₹222.33 | ₹14,451 | ₹14,451 | ₹18,049 |
| Bearish cross | Long 25,000 put at ₹336.14 | ₹21,849 | ₹21,849 | Large, down to zero |
| Bearish cross | Bear put spread, 25,000 and 24,500 puts, debit ₹178.74 | ₹11,618 | ₹11,618 | ₹20,882 |
A spread caps the gain but makes the loss on a failed cross small and known. Because crossover rules lose on many signals and make their money on a few, the size of the loss on failed signals often decides whether the strategy survives. Bought options also lose to time decay while a trend develops, which a spread offsets in part.
Position sizing
Size from the loss at the stop. A 1.5% stop on Nifty near 24,800 is about 372 points, ₹24,180 on one lot:
| Account | Risk budget at 1% | Futures lots at a 1.5% stop | Bull call spreads at ₹14,451 |
|---|---|---|---|
| ₹10,00,000 | ₹10,000 | 0 | 0 |
| ₹25,00,000 | ₹25,000 | 1 | 1 |
| ₹50,00,000 | ₹50,000 | 2 | 3 |
At 1% risk, a ₹10 lakh account cannot hold one futures lot or one full spread at these sizes. The choices are a narrower spread, a smaller share of the signals, or a larger share of the account at risk, decided before the first trade rather than after a loss. Recalculate the size at every entry, because the rupee risk of a percentage stop rises and falls with the index level.
Costs, slippage and tax
- Futures charges are about ₹970 a round trip on one Nifty lot, about 15 points, most of it the 0.05% STT on the sale. A rule that reverses on every cross pays it on every signal. Compare brokers in the brokerage calculator.
- Slippage is worst when many traders act on the same widely watched cross. Allow a point or two per order on index futures.
- Rollover. A trend trade held through the monthly expiry needs rolling to the next contract, a second round trip.
Brokerage, STT, exchange charges, SEBI fee, stamp duty and GST for one round trip, by broker.
Profits from futures and options are generally taxed as non-speculative business income.
How to backtest a crossover strategy
- Use several years of data, including trending and sideways years, and load enough history for the slow average before the first trade.
- Act on closed candles. A cross mid-session can reverse by the close.
- Include costs, slippage and rollovers on every trade.
- Test neighbouring pairs. If 9 and 20 works and 10 and 21 does not, the result is fragile.
- Test exits separately from entries.
- Keep data back for a final check on years the rule was not designed on.
- Read the losing streaks. Crossover rules can lose for months in a range; the longest streak decides whether the rule can be followed.
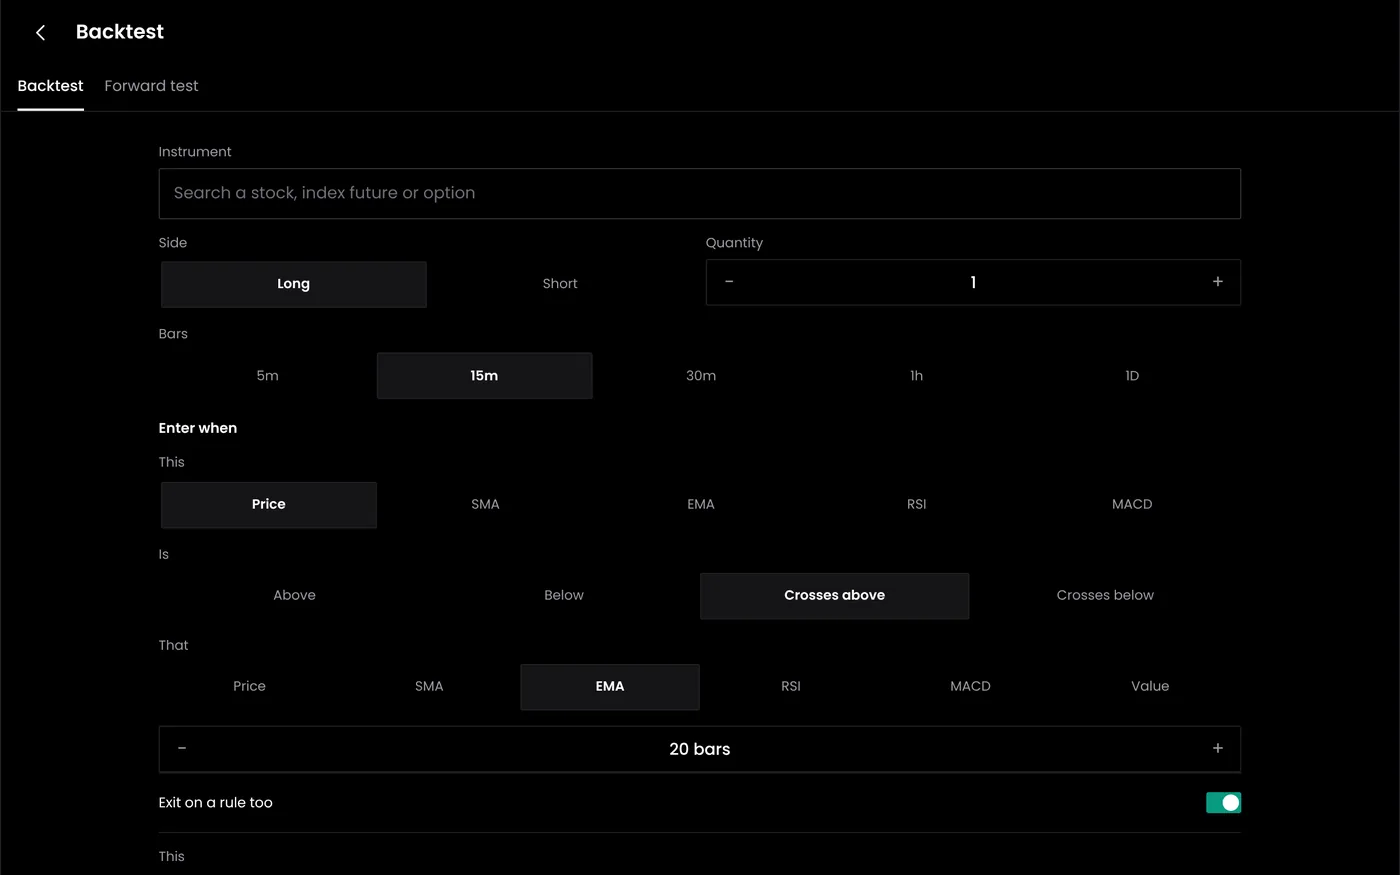
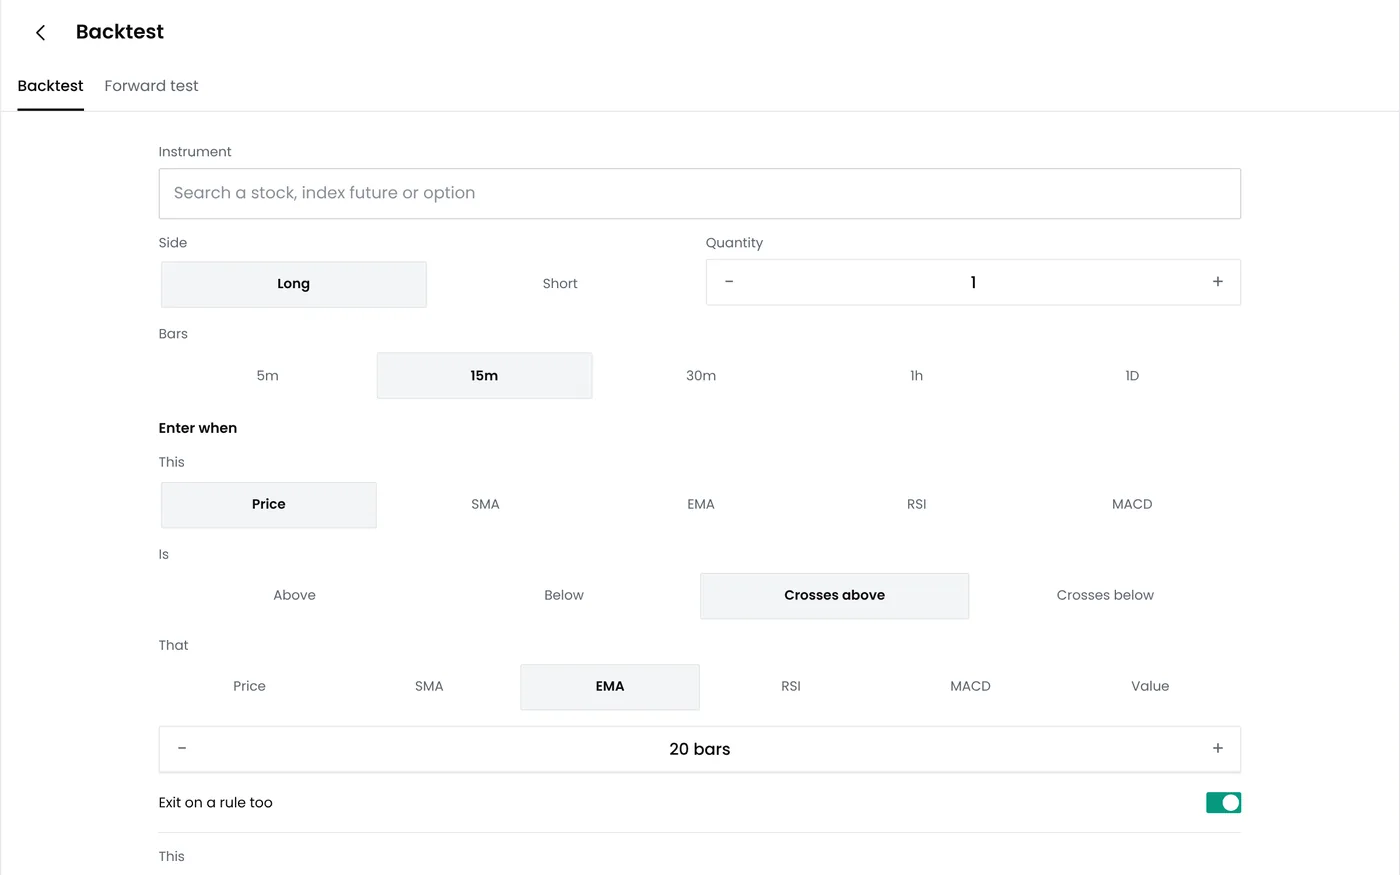
Setting up the crossover strategy in QuantPower
| Rule | Example setting |
|---|---|
| Instrument | Nifty futures, current month, rolled before expiry |
| Candles | Daily |
| Entry | 9-day EMA crosses the 20-day EMA, on the closing price |
| Filter | Optional: a minimum gap, or a long-term trend condition |
| Exit | The opposite cross, or a trailing exit |
| Stop | 1.5% from the entry |
| Size | 1% of capital at risk between entry and stop |
| Daily limit | Your MTM loss limit for the account |
Step 1. Build the rules
In the option strategy builder, choose Nifty futures and daily candles, add the crossover as the entry condition and the opposite cross as the exit, and set the contract to roll before expiry.
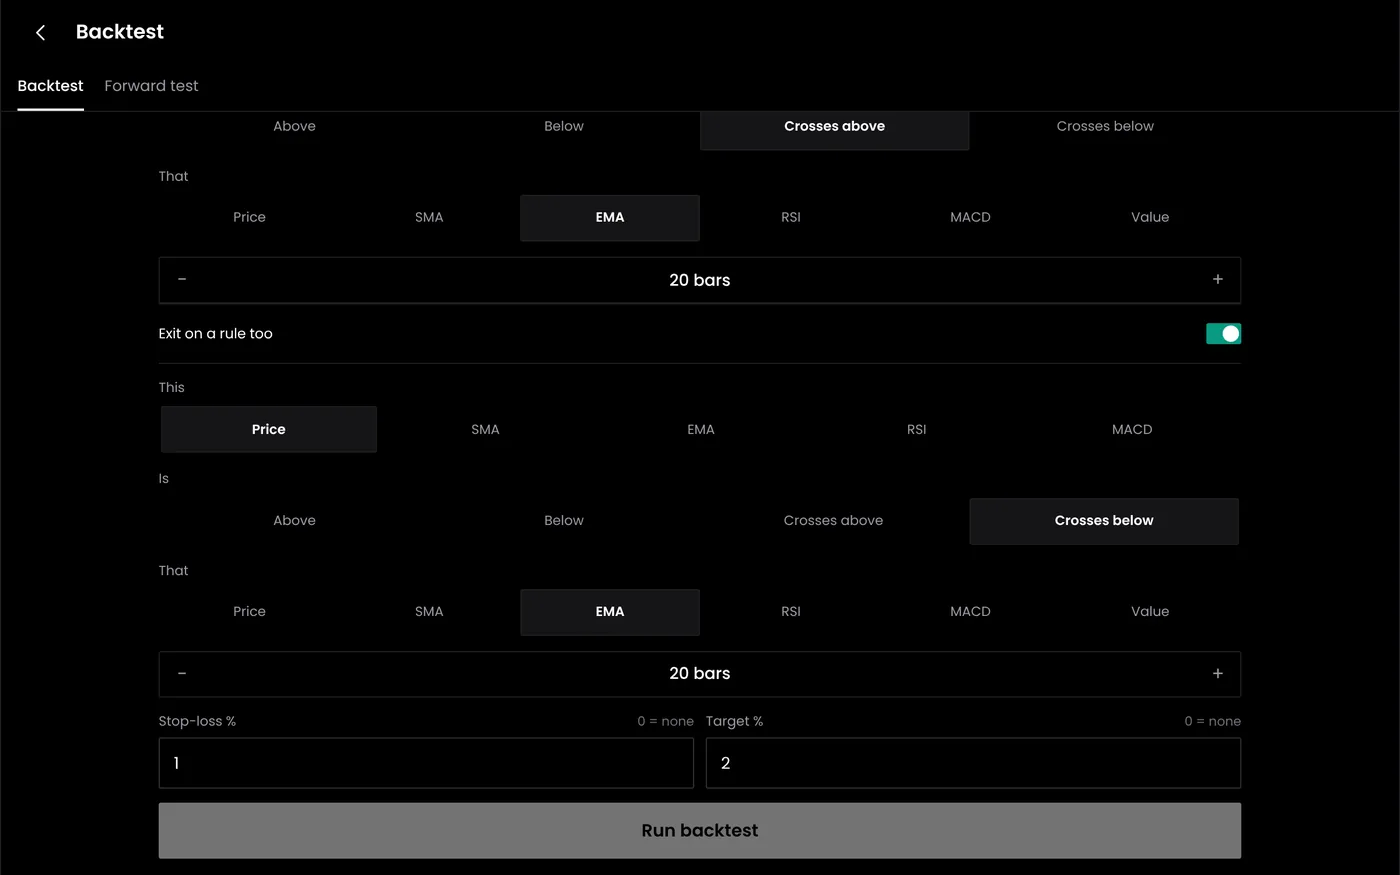
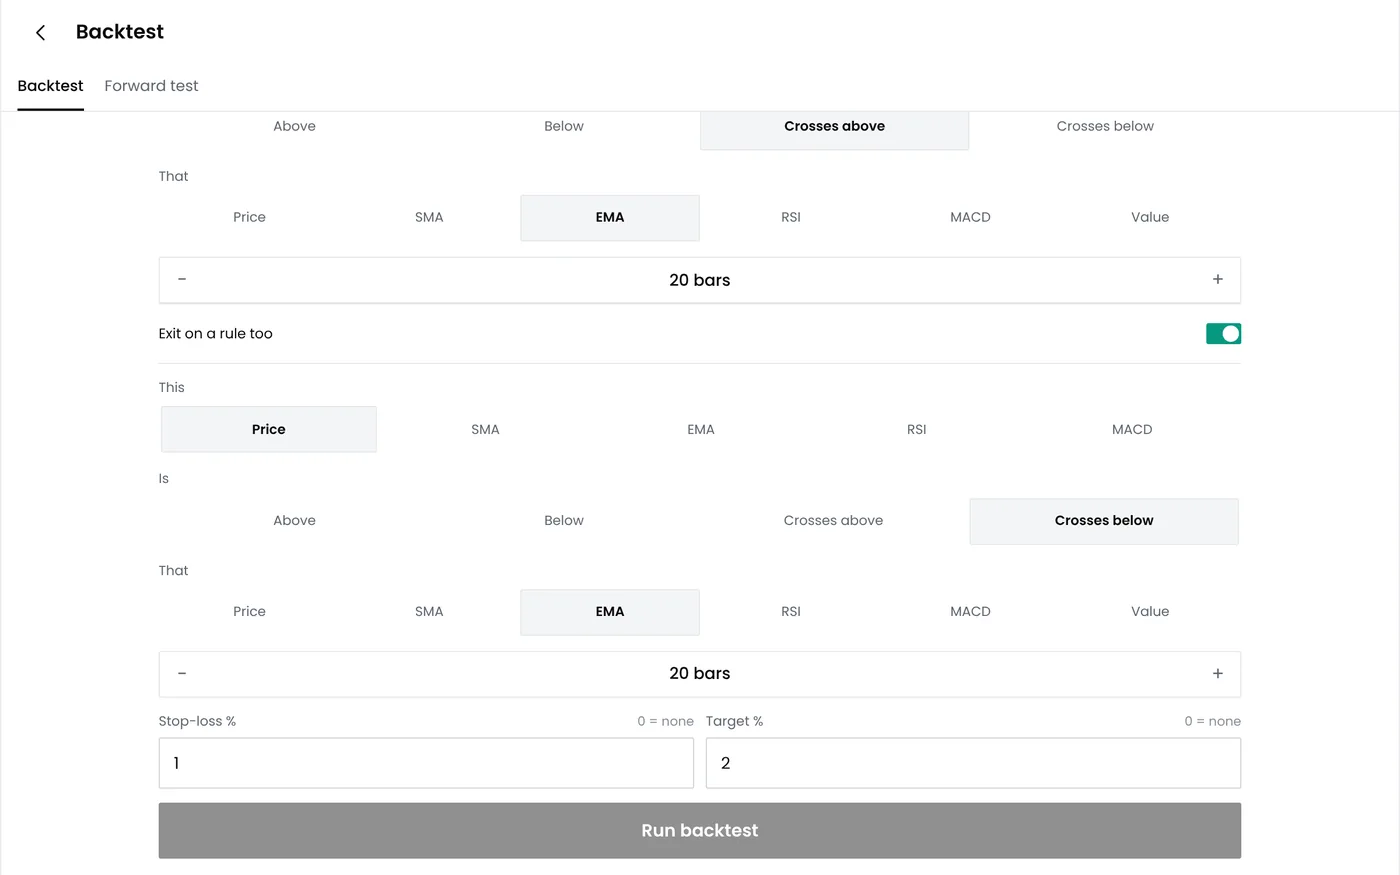
Step 2. Add the stop and filters
Set the percentage stop and any filter, such as a condition that the index is above its long moving average for longs.
Step 3. Backtest it
Run the rules in backtesting on five years of data with costs and slippage, and compare neighbouring pairs of averages.
Step 4. Paper trade it
Run the strategy on live prices with virtual money until it has taken several trades, and compare the fills with the backtest.
Step 5. Set the account limit
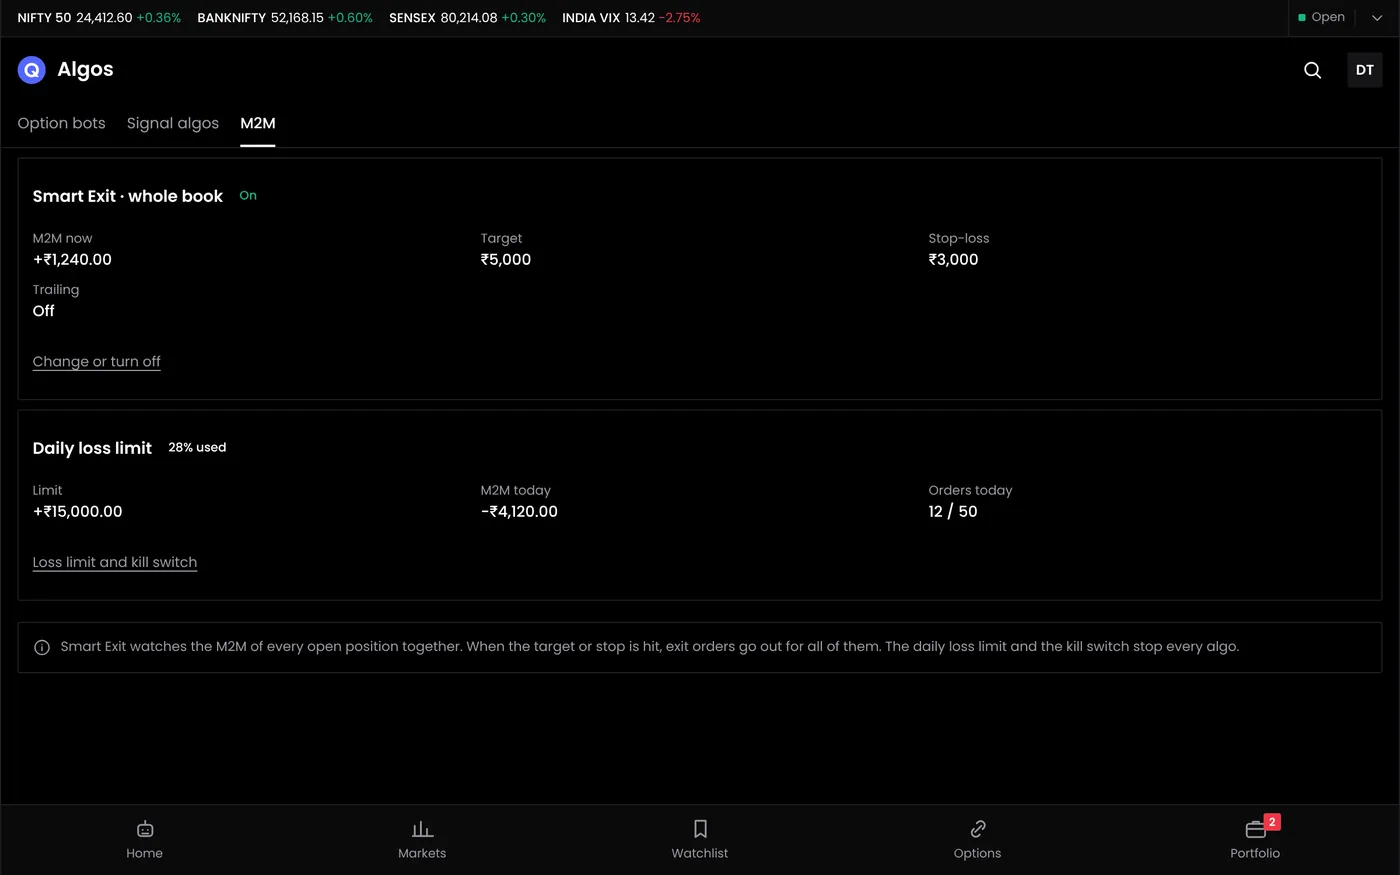
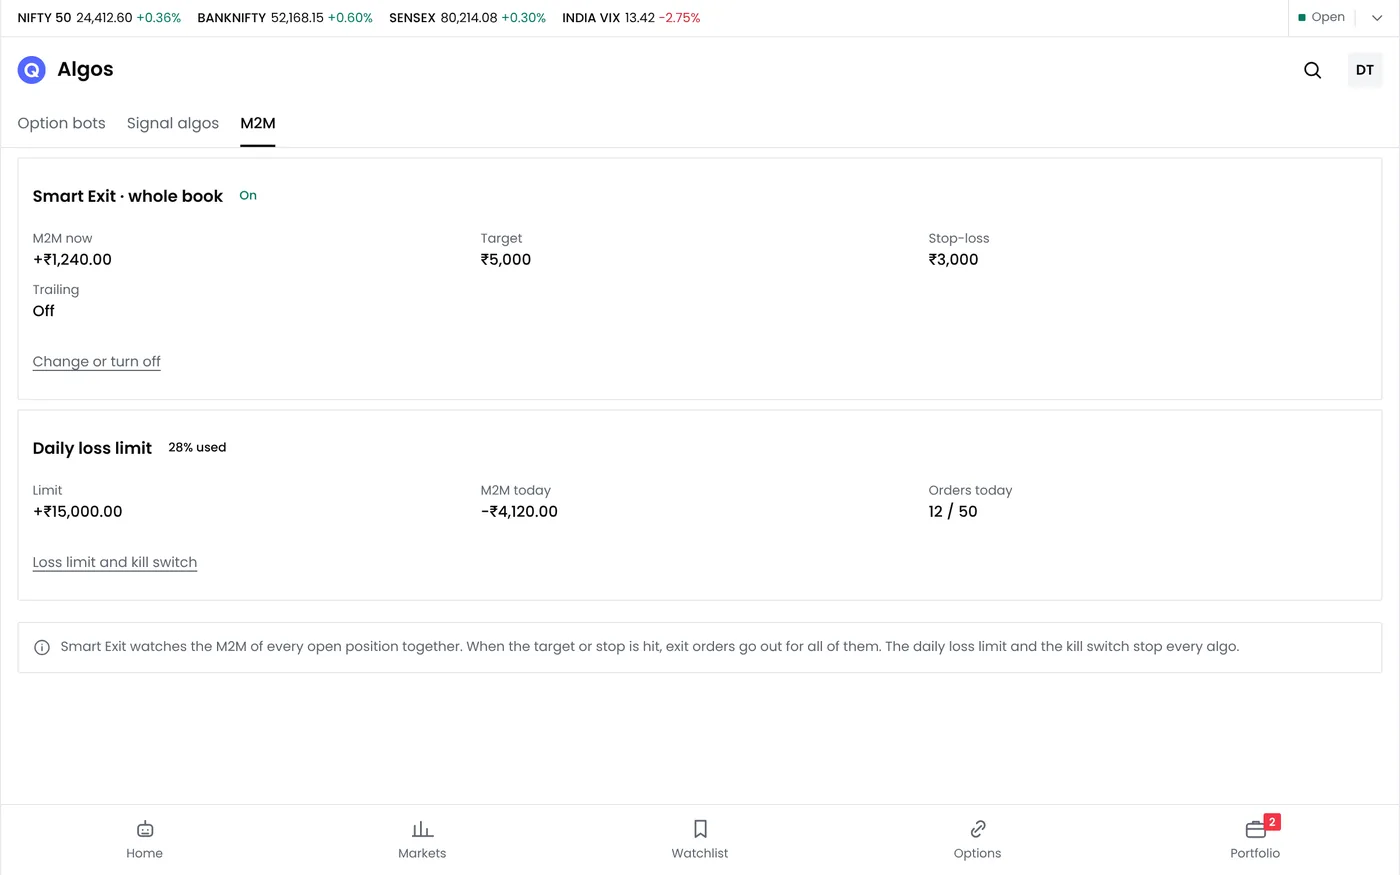
Set the daily MTM loss limit before going live. The limit squares off every position when it is hit.
Step 6. Deploy the bot
Connect your broker, choose the strategy and lots, confirm the limits and deploy.
Step 7. Monitor and pause
Review the trades each week and use Pause all to stop every bot at once if needed. Orders go through your connected broker under the requirements applicable to your strategy and account; a named example is not a claim of strategy approval.
When to stop trading the strategy
Set the conditions for pausing before the first trade: a losing streak longer than the backtest's longest, a drawdown more than about one and a half times the backtest's worst, or a market that has moved sideways for months. Review the trades against the backtest's before restarting.
Common mistakes
- Trading every cross in a range. Use a filter and test whether it helps.
- Choosing the pair that fitted last year. Prefer a pair whose neighbours work too.
- Exiting only on the opposite cross. It can give back most of a move; test faster exits.
- Ignoring costs. A fast pair that reverses often pays about 15 points every time.
- Sizing by margin. Size from the loss at the stop.
- Forgetting rollover on trades that run past expiry.
Pre-trade checklist
- The cross is on a closed candle.
- The filter, if used, agrees with the trade.
- No scheduled event falls before the next session.
- The stop is set before entry, and the size follows from it.
- The rollover date is known.
- The rules were backtested with costs and tested on unseen data.
- The strategy has taken several trades in paper trading.
Start your free trial
Connect your broker, build a strategy and test it on paper before a single live order goes out.
Frequently asked questions
Which moving average crossover is best?
There is no best pair for every market. Short pairs such as 9/21 suit short-term trading; longer pairs such as 50/200 suit long-term trends. Test several and choose settings that work across neighbouring values.
Is EMA better than SMA for crossovers?
EMA reacts faster, giving earlier signals and more whipsaws. SMA is slower and steadier. Neither is better in all conditions.
What is a golden cross?
When the 50-day moving average crosses above the 200-day moving average. It is a widely followed sign of a long-term uptrend. The opposite is called a death cross.
Do moving average crossovers work on Nifty?
They have historically caught long trends in Nifty and given back profits in sideways periods. Filters and stops matter more than the exact periods.
Why do crossovers lose money in sideways markets?
Because the averages cross back and forth while the price goes nowhere, and each cross is a trade that pays costs and a small loss before the next cross reverses it.
Can I use a crossover strategy on stocks?
Yes, with the same rules and three adjustments: use prices adjusted for splits and bonus issues, allow for gaps on results days, which can jump through a stop, and close or roll stock futures before the expiry week, because they settle by delivery of shares.
Should the stop be the opposite crossover?
It can be the exit, but it is usually too far away to be the only stop. A fixed initial stop, such as 1.5% from the entry, caps the loss if the market moves sharply against the trade before the averages cross back.
Related guides
- Moving averages: SMA and EMA, their weights and their lag
- MACD trend following strategy: trend rules built on MACD crosses
- Supertrend strategy: an ATR-based trend line and trailing stop
- ADX strategy: measuring trend strength to filter crosses
- Multi timeframe strategy: taking direction from a slower chart
- Technical indicators: the common indicators side by side
- Option strategy builder: build and automate the rules
Sources
- Murphy, J. J. (1999). Technical Analysis of the Financial Markets. New York Institute of Finance
- Finance Act, 2026: STT on futures and options from 1 April 2026
- NSE: trading hours and contract specifications for Nifty futures and options