
Before you start
Run a backtest first. The backtest tutorial shows how, including costs and slippage. Results without costs are not worth reading.
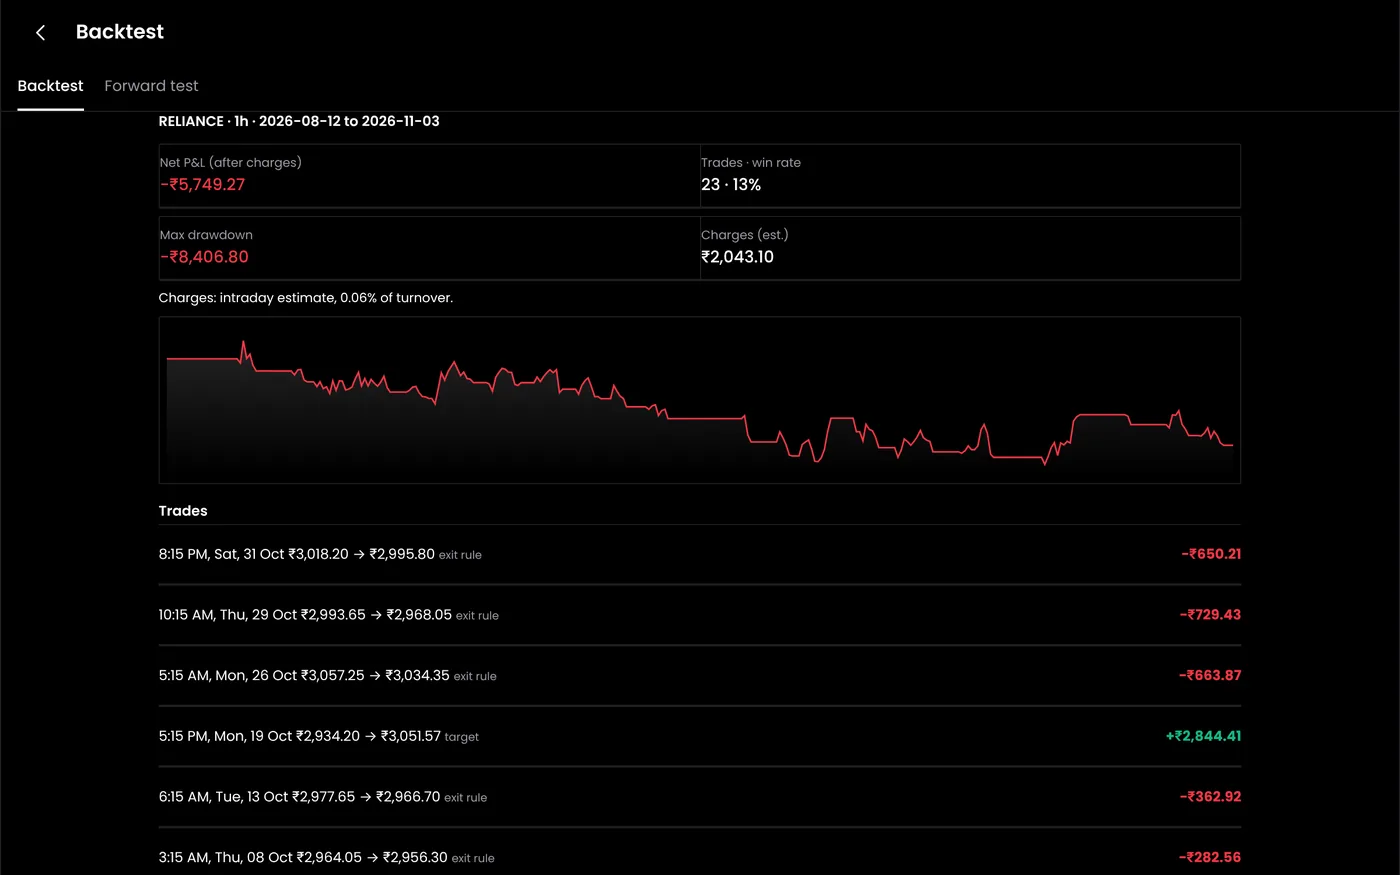
Step 1: Read the summary metrics
| Metric | What it tells you | What to look for |
|---|---|---|
| Net P&L | Profit or loss after the costs you set | Positive after costs, across the whole period |
| Win rate | Share of trades that made money | Read it with the average win and loss, never alone |
| Max drawdown | Largest fall from a peak in the equity curve | A fall you could live through again |
| Trades | Number of completed trades | Enough to mean something: dozens, not a handful |
| Profit factor | Gross profit divided by gross loss | Above 1 means profits beat losses. Close to 1 leaves little room for error |
| Average trade | Net P&L divided by the number of trades | Large enough that extra slippage would not wipe it out |
Our guide to backtest performance metrics covers each measure in detail.
Step 2: Check the average trade against costs
This check catches many fragile strategies. Suppose a test shows:
| Item | Value |
|---|---|
| Net P&L | ₹60,000 |
| Trades | 186 |
| Average trade | ₹322.58 |
| Orders per trade | 4 |
If live slippage turns out one point worse per order on 65 units, each trade costs another 4 × 65 = ₹260. The average trade falls from ₹322.58 to ₹62.58, and the strategy barely breaks even. A strategy with a larger average trade has more room for error.
Step 3: Read the equity curve
The equity curve shows the running total of profit and loss. Look at its shape, not only where it ends:
- A steady rise suggests profits come from many trades.
- A few big jumps mean a handful of trades made most of the money. Ask whether those days will repeat.
- Long flat stretches show how long you might wait without new highs.
Step 4: Read the drawdown chart
The drawdown chart shows how far the equity curve sat below its last peak. Note three things:
- The deepest point. This is the maximum drawdown.
- How long it lasted. Months under water test discipline more than one bad week.
- When it happened. If it came in one market regime, think about whether that regime could return.
Assume the live drawdown will be deeper than the test. The max drawdown calculator shows what a drawdown means for your capital and the gain needed to recover.
Step 5: Check the trade list
Open a few trades and compare them with the chart:
- Entries: did each trade start when the rules say?
- Exits: the list shows what closed each trade, such as the stop loss or the 15:15 time exit. If one exit type dominates, ask why.
- Worst trades: were they within the rules, or did a gap or an event day cause them?
Step 6: Decide what happens next
| What you see | Next step |
|---|---|
| Positive after costs, drawdown acceptable, enough trades | Paper trade it for several weeks |
| Positive only without costs or slippage | Rework the strategy before going further |
| Good results that collapse with small changes | Treat it as overfitted. See avoiding overfitting |
| Good in one period, poor in another | Test more periods, or use walk-forward testing |
Common problems
| Problem | What to do |
|---|---|
| The win rate is high but net P&L is low | Losses are much larger than wins. Check the stop loss |
| One trade makes most of the profit | Run the test without that day and see what is left |
| Results differ from a TradingView test | Data, costs and fill assumptions differ. Compare the trade lists |
Next steps
- Start paper trading
- Calculate risk-adjusted returns with the Sharpe ratio calculator
- Read about common backtesting mistakes
Frequently asked questions
What is a good win rate?
There is no single answer. Option sellers often win most trades but lose more on each loss; trend followers often win less than half and make it up on large winners. Read the win rate with the average win and loss.
How many trades are enough?
More is better. A few dozen trades is a minimum for a rough view; a few hundred across different markets says much more.
Why did my live results differ from the backtest?
Slippage, missed fills, rejections and changed market conditions. Compare live trades with the backtest for the same days in strategy performance reports.