
This guide covers the whole trade: how RSI is calculated, the swing and intraday rule sets, a worked trade on Nifty futures with every cost counted, how to trade the same signal with options, filters, exits, position sizing, backtesting, and how to run the rules as an algo bot in QuantPower.
The RSI indicator strategy at a glance
| Feature | RSI mean reversion |
|---|---|
| Market view | A short-term overshoot that reverts toward the average |
| Instruments | Nifty and Bank Nifty futures, index options, liquid F&O stocks |
| Indicator | RSI(2) on daily candles for swing trades; RSI(14) on 15-minute candles for intraday |
| Entry | RSI below an oversold level while the longer trend is up |
| Exit | A close above a short average, an RSI recovery, a stop or a time stop |
| Pattern of results | Many small wins, fewer but larger losses |
| Main risk | Buying a market that keeps falling |
| Costs | High relative to the move: futures STT is 0.05% of the sale value |
| Holding time | One to five sessions (swing) or 30 to 120 minutes (intraday) |
| Difficulty | Intermediate: simple rules that need careful testing |
Key takeaways
- RSI compares recent gains with recent losses on a scale of 0 to 100. A mean reversion strategy buys when it is very low in an uptrend and sells when it recovers.
- The swing version buys when the 2-period RSI closes below 10 above the 200-day average, and sells on a close above the 5-day average.
- In the worked trade, one lot of Nifty futures gains 60 points, or ₹3,900, before costs. Costs take about ₹970, most of it securities transaction tax.
- Intraday, with a 68-point target and a 42-point stop, costs raise the win rate needed to break even from about 38% to about 52%.
- Options can carry the same signal with a known maximum loss. A bull put spread earns if the market simply stops falling.
- The rules are widely published. Test them on data you did not use to choose the settings, with costs, before any live order.
How RSI is calculated
RSI was introduced by J. Welles Wilder Jr. in 1978. For each period it records the gain if the close rose and the loss if it fell, averages them with Wilder's smoothing, and turns the ratio into a number between 0 and 100:
Readings above 70 are traditionally called overbought and readings below 30 oversold. Short periods react faster: a 2-period RSI can go from 100 to single digits in three sessions. Our guide to the RSI indicator explains the indicator itself; this page is about trading rules built on it.
Here is a 2-period RSI on illustrative Nifty closes, with the 5-day average used as the exit line. The series starts at 25,060 on day 0 and 25,110 on day 1, so the first averages are available on day 2:
| Day | Nifty close | Change | Average gain | Average loss | RSI(2) | 5-day average |
|---|---|---|---|---|---|---|
| 2 | 25,180 | +70 | 60.00 | 0.00 | 100.0 | — |
| 3 | 25,240 | +60 | 60.00 | 0.00 | 100.0 | — |
| 4 | 25,210 | −30 | 30.00 | 15.00 | 66.7 | 25,160 |
| 5 | 25,120 | −90 | 15.00 | 52.50 | 22.2 | 25,172 |
| 6 | 25,020 | −100 | 7.50 | 76.25 | 9.0 | 25,154 |
| 7 | 24,960 | −60 | 3.75 | 68.13 | 5.2 | 25,110 |
| 8 | 24,990 | +30 | 16.88 | 34.06 | 33.1 | 25,060 |
| 9 | 25,080 | +90 | 53.44 | 17.03 | 75.8 | 25,034 |
| 10 | 25,150 | +70 | 61.72 | 8.52 | 87.9 | 25,040 |
Three falling sessions take RSI(2) from 100 to 9.0, below the usual swing entry level of 10. Two rising sessions take it back to 75.8. The same 220-point fall would move a 14-period RSI much less, which is why short periods suit short trades.

Why mean reversion can work, and when it fails
Over a few days, prices often overshoot. Forced selling, stop losses and fear can push an index below where buyers step back in, and a partial recovery follows. Studies of US stocks found that the previous week's or month's biggest losers tended to do better than average over the following week or month (Lehmann, 1990; Jegadeesh, 1990). Whether that holds on Nifty, in your period and after costs, is something to test rather than assume.
The strategy does not predict the long-term direction. It bets on a short bounce, so it needs conditions where bounces happen:
It tends to work when:
- The longer trend is up and pullbacks are short.
- The market is range-bound.
- Falls come from short-term selling rather than news that changes the outlook.
It tends to fail when:
- A downtrend keeps RSI oversold for weeks. "Oversold" can become more oversold.
- A gap on news, such as an RBI surprise or a global shock, moves the market past the stop.
- Volatility rises sharply and pullbacks turn into crashes.
This is why nearly every RSI mean reversion system uses a trend filter, and why the stop and the size matter more than the entry.
The swing rules: RSI(2) on daily candles
A widely tested swing version, popularised by Larry Connors and Cesar Alvarez, uses a 2-period RSI with a long trend filter:
- Trend filter. Trade long only when the close is above its 200-day simple moving average.
- Entry. Buy when the 2-period RSI closes below 10.
- Exit. Sell on the first close above the 5-day simple moving average.
- Stop. Exit if the price falls 1.5 times the 14-day average true range (ATR) below the entry.
- Time stop. Exit after five sessions if neither the exit nor the stop has triggered.
- Size. Risk a fixed share of capital, such as 1%, between the entry and the stop.
The mirror rules sell short when the close is below the 200-day average and RSI(2) closes above 90. Many traders run only the long side on Indian indices, because the short side fights the long-term upward drift of the index and short squeezes can be violent. Test both sides separately.
A worked swing trade on Nifty futures
Here is how the swing rules apply to the closes in the table above, on one lot of Nifty futures (65 units). Assume the 200-day average is near 24,300 and the 14-day ATR is about 210 points. It is an illustration of the mechanics, not a record of results, and it treats the futures price as equal to the index.
- Day 6, closeNifty 25,020, above its 200-day average. RSI(2) closes at 9.0, below 10. Buy one lot at 25,020: a contract value of about ₹16.3 lakh and a margin of roughly ₹2 lakh. Stop at 24,705 (1.5 × ATR, 315 points), a risk of ₹20,475. Time stop: five sessions.
- Day 7, closeNifty 24,960 and RSI(2) 5.2. The position is down ₹3,900. The rules do not add to a losing trade, and the stop is still 255 points away.
- Day 8, closeNifty 24,990, still below its 5-day average of 25,060. The position is down ₹1,950.
- Day 9, closeNifty 25,080 closes above its 5-day average of 25,034. Exit at 25,080: a gain of 60 points, or ₹3,900 before costs.
- Costsbrokerage ₹40, STT ₹815, exchange charges ₹60, stamp duty ₹33, GST ₹19 and the SEBI fee ₹3, about ₹969 in total. Net gain about ₹2,931.
Three things stand out. The trade spent two sessions under water, so a tight stop just under the entry would have turned a winner into a loss on day 7. Mean reversion needs room, which means a wider stop and a smaller position. Costs took a quarter of the gross gain, mostly the 0.05% STT on the futures sale. And the gain was small compared with the risk: the stop put ₹20,475 at risk to make ₹3,900. That is normal for this style, and it is why the win rate and the size of the average loss have to be measured together.
The intraday rules: RSI(14) on 15-minute candles
The same idea works within a day, with a longer RSI on shorter candles:
- Direction. Trade long only while the price is above the day's VWAP, and short only while it is below.
- Entry. Buy when the 14-period RSI dips below 30 and then closes back above 30.
- Target. Exit at the session high, or when RSI reaches 60 to 70.
- Stop. Exit below the low of the pullback.
- Time stop. Exit after 90 minutes if neither level has been hit.
- Session exit. Close everything by 3:10 pm, before the closing auction in the index stocks begins at 3:15 pm.

An intraday example, with costs
On a 15-minute chart, Nifty futures trade above the day's VWAP. A pullback drives RSI(14) to 27, and the next candle closes with RSI at 33 and the price at 25,060. The bot buys one lot at 25,062, with a stop at 25,020 below the pullback low and a target at the morning high of 25,130.
| Outcome | Points | Before costs | Costs | After costs |
|---|---|---|---|---|
| Target hit | +68 | +₹4,420 | ₹971 | +₹3,449 |
| Stop hit | −42 | −₹2,730 | ₹967 | −₹3,697 |
Before costs, the trade breaks even if it wins about 38% of the time. After costs, it needs to win about 52%. A rule that looked comfortably profitable in a gross backtest can be a loser in practice.
Filters that keep you out of falling markets
- Trend. The 200-day average for swing trades; VWAP or the opening range for intraday trades.
- Market filter for stocks. Take stock signals only when Nifty itself is above its 200-day average.
- Volatility. Skip new entries, or halve the size, when India VIX is well above its own recent range.
- Events. Skip RBI policy days, the Union Budget and, for stocks, results days.
- Gaps. Skip a signal that comes from a gap of more than about 1% on news. A fall caused by news is not the same as an overshoot.
- Volume. A sharp fall on very heavy volume more often reflects new information than a short-term overreaction.
Each filter removes trades. Add them one at a time in testing and keep only those that reduce the worst losses without removing most of the gains.
Exits
In mean reversion, the exit decides as much as the entry.
| Exit | How it works | Trade-off |
|---|---|---|
| Short moving average | Sell on a close above the 5-day average | Simple and widely tested; can exit before the full bounce |
| RSI recovery | Sell when RSI rises above 50 or 70 | Follows the move; can exit early in a strong bounce |
| Price stop | Sell at a set ATR multiple below the entry | Caps the loss; too tight and it cuts winners |
| Time stop | Sell after a set number of sessions | Stops a loser from drifting; may cut a slow winner |
| Trailing stop | Follows the price up once in profit | Protects gains; can be hit by normal noise |
| Account limit | Squares off everything at the day's loss limit | Protects the account when several strategies lose together |
Most versions combine a signal exit, a price stop and a time stop.
RSI settings compared
| RSI period | Typical entry and exit levels | Behaviour |
|---|---|---|
| 2 | Below 5 to 10; above 70 to 90 | Very fast; frequent extreme readings; suits swing trades on daily candles |
| 3 to 5 | Below 15 to 20; above 80 | Fast; fewer signals than RSI(2) |
| 14 | Below 30; above 70 | Smooth; the traditional setting; suits intraday candles and trend checks |
Shorter periods reach extremes more often, so they need stricter levels. Whatever you choose, test the neighbouring settings too, and prefer a setting that works across its neighbours over a single best number.
Trading the signal with options
Futures make or lose ₹65 per Nifty point on one lot, and the swing stop above put ₹20,475 at risk. Options can carry the same oversold signal with a smaller or a known loss. Model values with Nifty at 25,000, 12 days to expiry and IV of 14%, per lot of 65:
- Long call: buy the 25,000 call at ₹280.48, or ₹18,231. Delta is about ₹35 per point, and time decay costs about ₹850 a day.
- Bull call spread: buy the 25,000 call and sell the 25,300 call for a debit of ₹130.36, or ₹8,474. The maximum profit is ₹11,026.
- Bull put spread: sell the 24,800 put and buy the 24,500 put for a credit of ₹80, or ₹5,200. The maximum loss is ₹14,300, and the spread earns about ₹132 a day from time decay.
The P&L per lot two or three sessions later, in the model:
| Nifty after the signal | Futures | Long call | Bull call spread | Bull put spread |
|---|---|---|---|---|
| Up 150 points in two sessions | +₹9,750 | +₹3,980 | +₹1,762 | +₹1,728 |
| Flat after three sessions | ₹0 | −₹2,652 | −₹338 | +₹457 |
| Down 150 points in two sessions | −₹9,750 | −₹6,447 | −₹2,103 | −₹1,439 |
| Down 300 points in two sessions | −₹19,500 | −₹10,169 | −₹3,799 | −₹3,362 |
The long call needs the bounce to come quickly, because it pays ₹850 a day while it waits. The spreads give up most of the upside, but they lose far less when the signal fails. The bull put spread is the only one that makes money if the market simply stops falling, which is often what happens after an oversold reading. Choose the expression by what you expect after the signal: a sharp bounce, a pause, or neither.
Interactive payoff chart: change the spot, IV, lot size and days to expiry to see the curve, breakevens and Greeks.
Options need exits in their own terms as well as on the index: a time stop for bought options, and a loss limit on the spread's value.
Position sizing
Mean reversion stops sit further away than breakout stops, so size each trade from the stop, not from the margin.
Because these strategies win often and lose less often but more, check the longest losing streak and the deepest drawdown in testing before choosing a size. The position size calculator turns a rupee risk and a stop distance into lots, and the F&O margin calculator estimates the margin.
Costs, slippage and tax
Short trades pay costs often, and futures costs are now heavy:
- STT on futures is 0.05% of the sale value since 1 April 2026: about ₹815 on one lot sold at 25,080. All charges together come to about ₹970, close to 15 Nifty points per round trip.
- STT on options is 0.15% of the premium on the sale: about ₹33 on the call trade above, with about ₹98 in total charges.
- Slippage is worst on stops, which trigger in fast markets. Allow at least a point or two per order on index futures and more on stocks.
A swing strategy that trades 20 times a year on one lot pays about ₹19,400 a year in charges on futures before any slippage. Use the calculator for your broker and put the figure into every backtest.
Brokerage, STT, exchange charges, SEBI fee, stamp duty and GST for one round trip, by broker.
Profits from futures and options are generally taxed as non-speculative business income.
How to backtest an RSI indicator strategy
- Use the right data. Daily closes for the swing rules, using continuous futures adjusted for rolls or the index plus a roll cost; 15-minute candles for the intraday rules; option prices for the options versions.
- Fill realistically. A signal that needs the close cannot also fill at that close. Use the next open, or a price a few minutes before the close with slippage.
- Test a grid, then its neighbours. RSI periods of 2, 3 and 4; entry levels of 5, 10 and 15; each exit; the trend filter on and off; stops at 1, 1.5 and 2 ATR.
- Count the trades. Swing signals on one index come only a handful to a few dozen times a year. Test over many years and, where it makes sense, on several instruments.
- Avoid survivorship bias on stocks by testing on the index members at each date, including companies later removed.
- Compare with buy and hold on the same instrument over the same period, after costs.
- Keep a final period unseen until the rules are fixed, and test once on it.
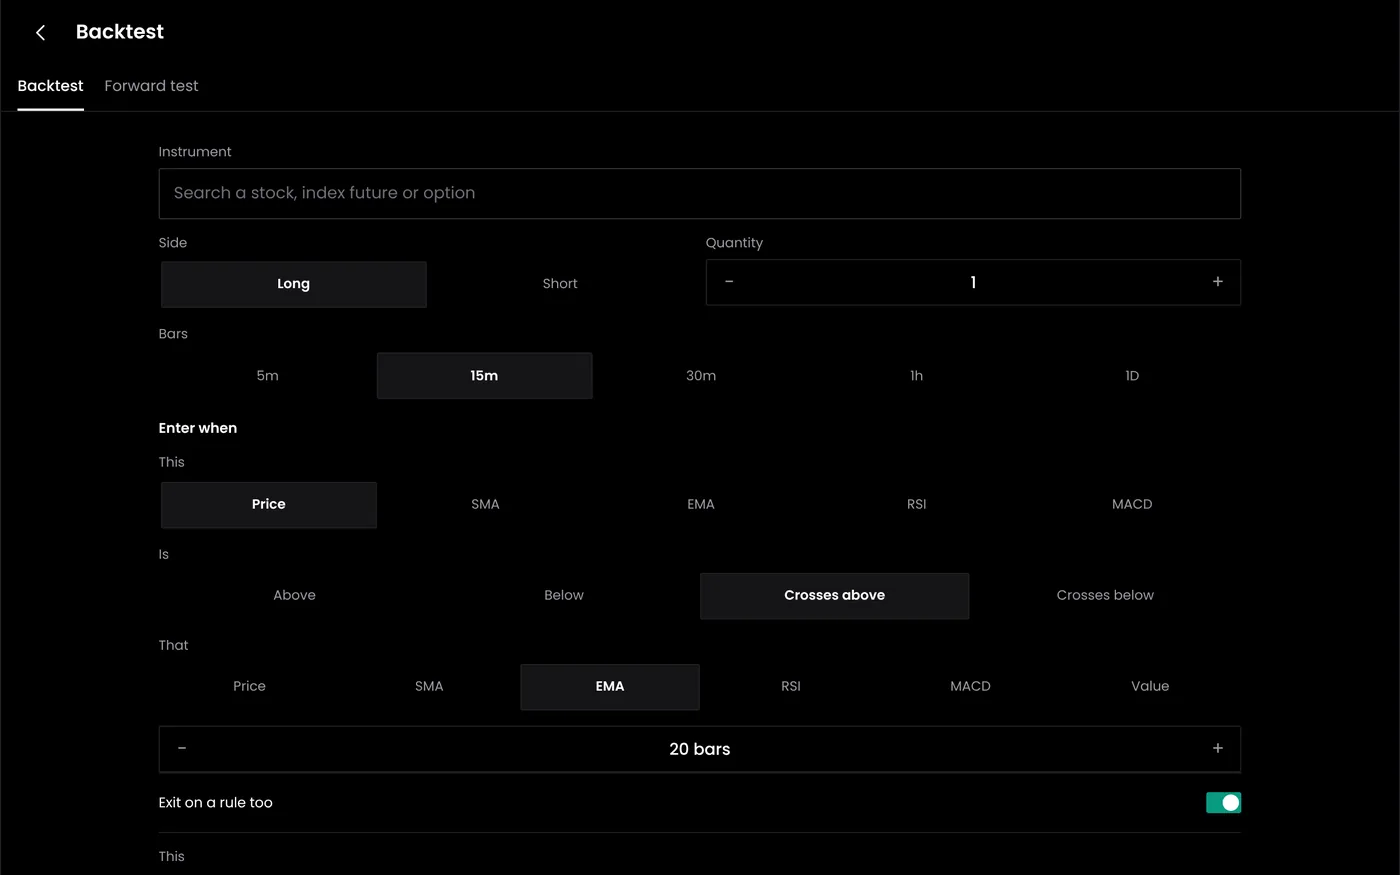
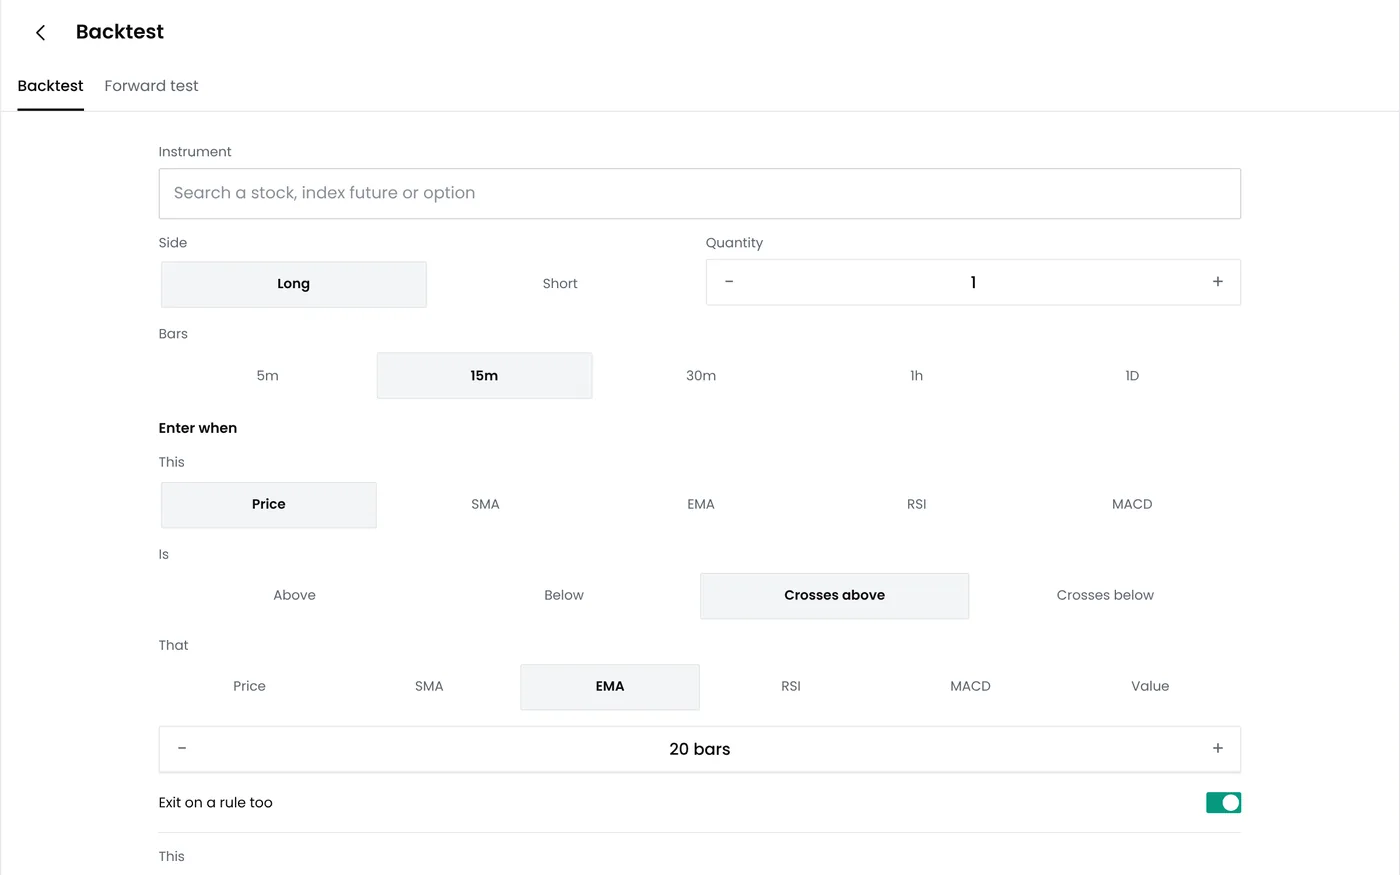
Our guides on how to backtest trading strategies, avoiding overfitting and walk-forward testing cover each step, and the backtesting engine runs the rules with costs included.
Setting up the RSI strategy in QuantPower
RSI rules are exact, which makes them easy to automate and easy to break by hand: the hardest part is buying after three red days and selling on the first green one. A sample rule set for the swing version:
| Rule | Example setting |
|---|---|
| Instrument | Nifty futures, current month, rolled before expiry |
| Candles | Daily |
| Trend filter | Close above the 200-day simple moving average |
| Entry | RSI(2) below 10 on the 3:10 pm price; buy before 3:15 pm |
| Exit | Price above the 5-day simple moving average on the 3:10 pm check |
| Stop | 1.5 × ATR(14) below the entry |
| Time stop | Five sessions |
| Size | 1% of capital at risk between entry and stop |
| Skip days | RBI policy, Union Budget and other event days |
| Daily limit | Your MTM loss limit for the account |
The entry and exit use the 3:10 pm price because the index stocks stop trading continuously at 3:15 pm, when the closing auction that sets their closing prices begins. Some traders prefer to act on the next morning's open instead; test both.
Step 1. Build the rules
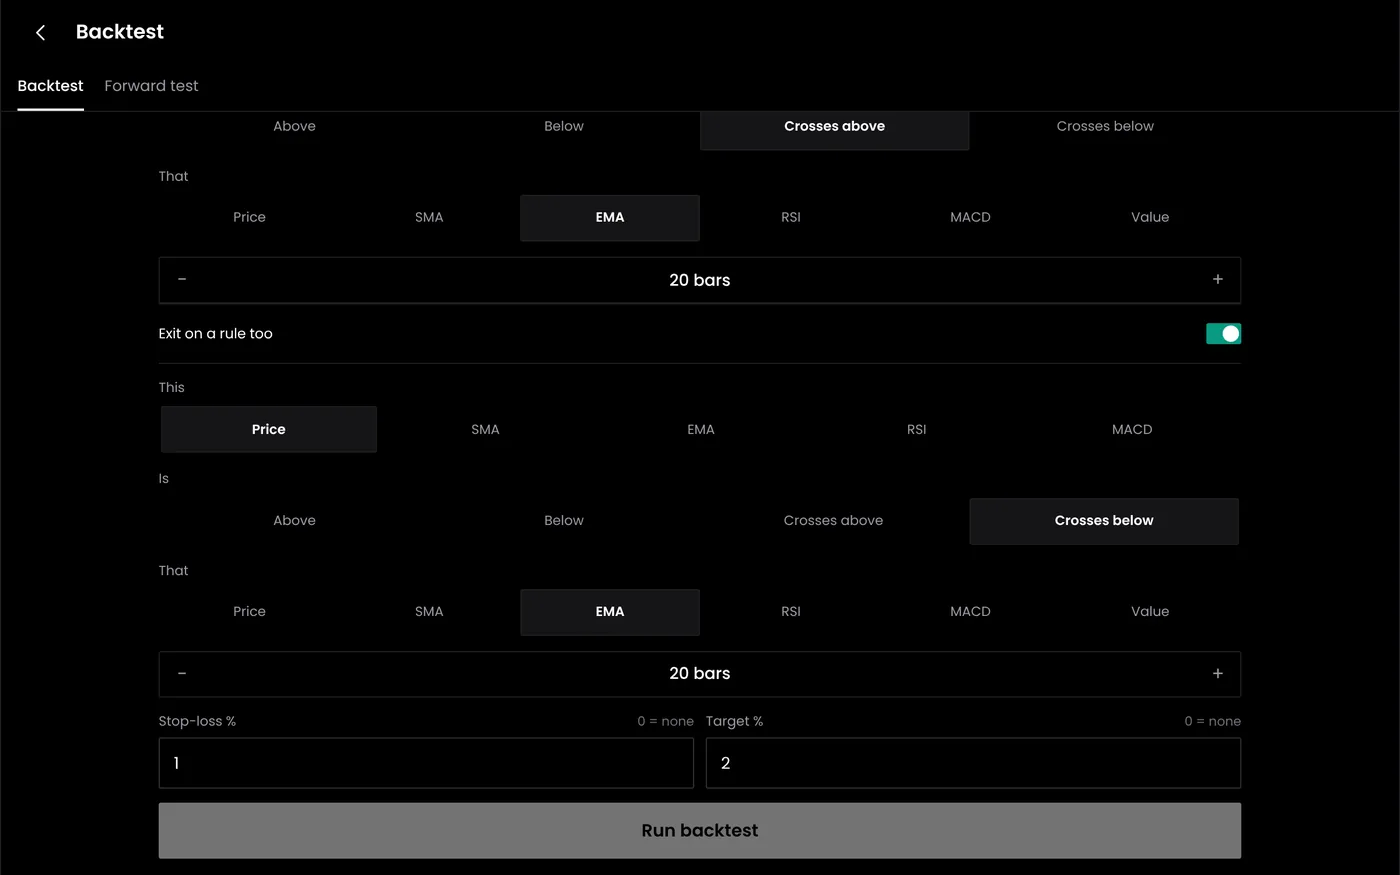
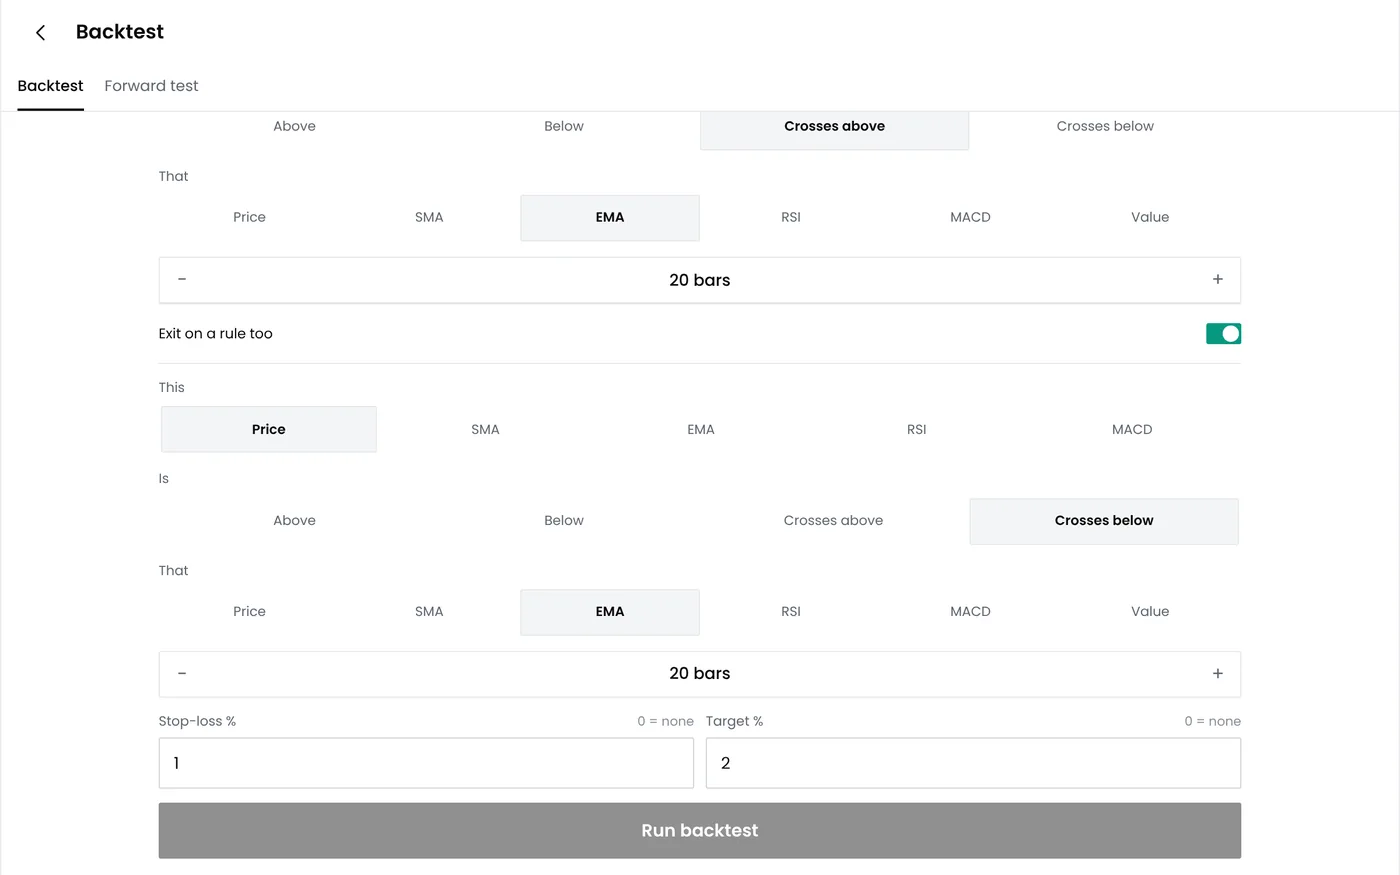
In the strategy builder, choose Nifty futures and daily candles, then add the RSI(2) entry condition, the 200-day trend filter and the exit on the 5-day average.
Step 2. Add the stops and filters
Set the ATR stop, the five-session time stop and the event-day filter.
Step 3. Backtest it
Run the rules over past years with costs and slippage on, then change one setting at a time.
Step 4. Paper trade it
Run the strategy on live prices with virtual money until it has taken several trades, and compare the fills with the backtest.
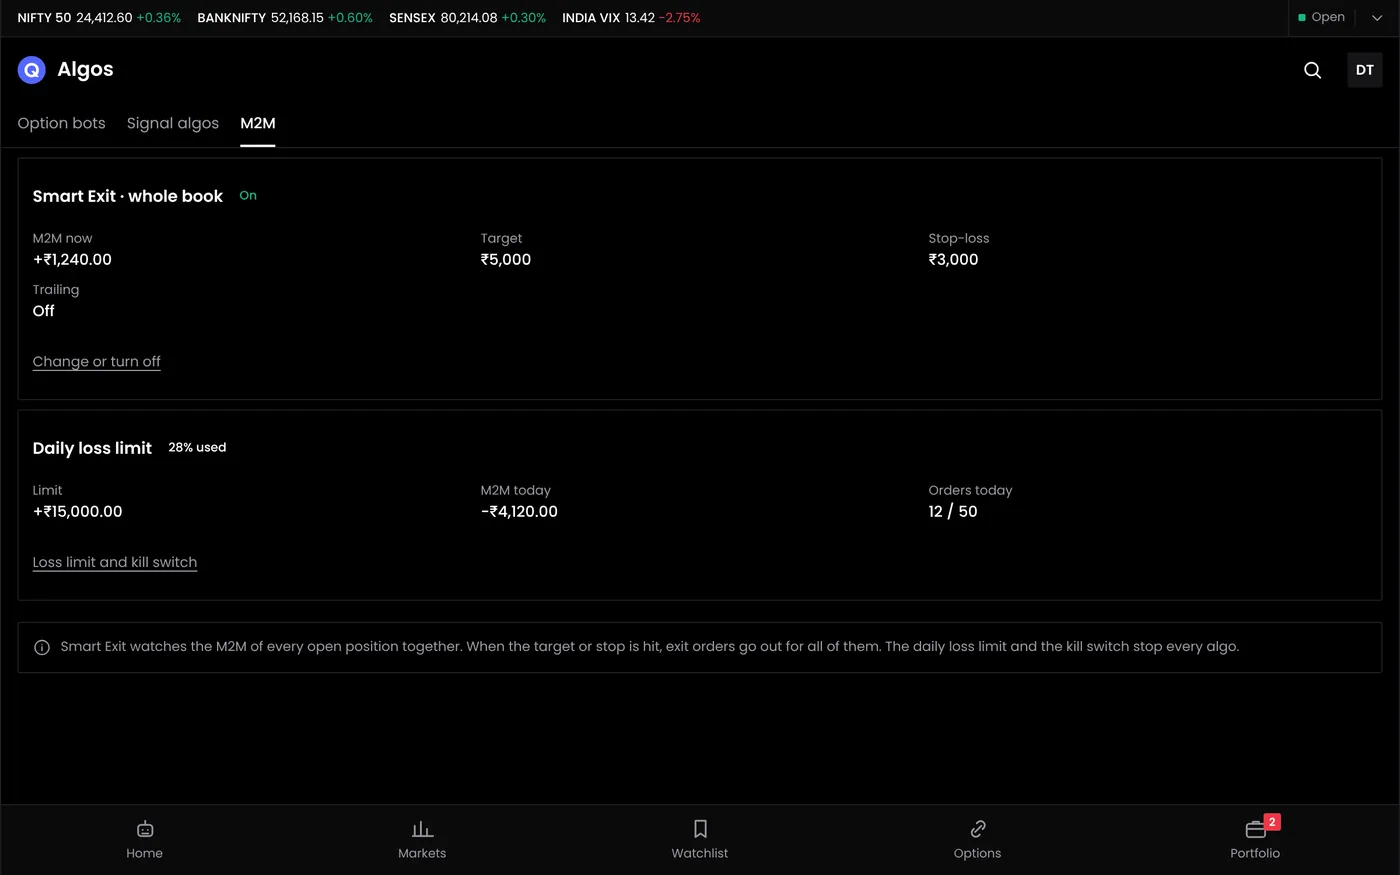
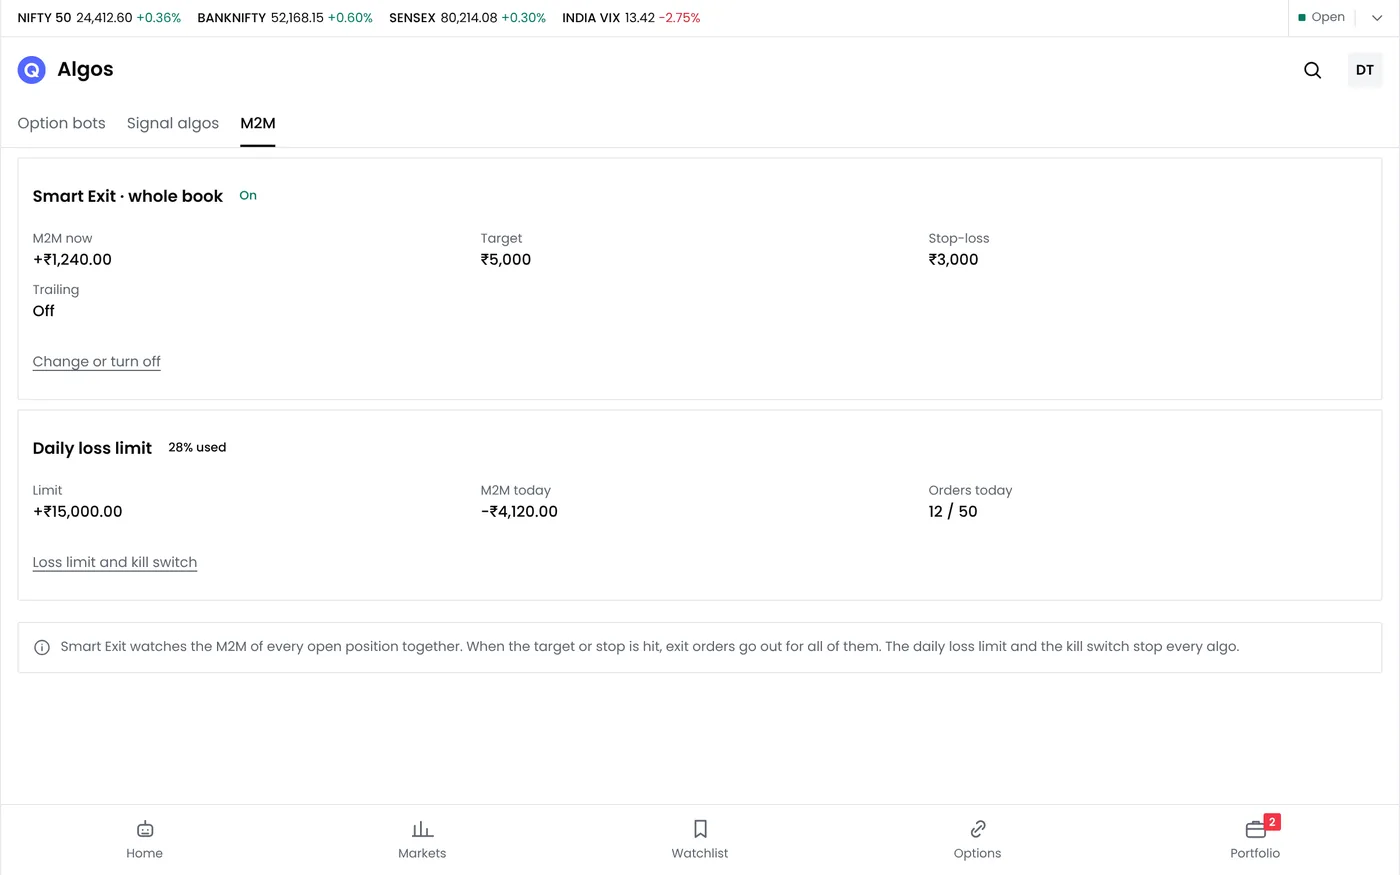
Step 5. Set the account limit
Set the daily MTM loss limit in the risk settings before going live. The limit squares off every position when it is hit.
Step 6. Deploy the bot
Connect your broker, choose the strategy and lots, confirm the limits and deploy. The bot checks the signal each afternoon and manages the exits on its own.
Step 7. Monitor and pause
Review the trades each week and use Pause all if you need to stop every bot at once. The bot uses broker infrastructure or the client’s own static IP setup, not Wisdom Tree Ventures servers. Client-hosted operation needs the host and broker session to stay available; broker-hosted clients do not need their own static IP.
Orders use the applicable broker-hosted or client-static-IP connection and its account permissions.
Common mistakes
- Buying every oversold reading without a trend filter.
- Treating 30 and 70 as fixed rules for every period, instrument and timeframe.
- Averaging down because RSI is "even more oversold".
- Setting a tight stop on a strategy that needs room, then removing stops after a few losses.
- Sizing by margin instead of by the distance to the stop.
- Ignoring costs, which take a large share of small, frequent gains.
- Optimising the settings until the backtest looks perfect on one period.
- Confusing mean reversion with divergence. They are different signals; see the RSI divergence strategy.
Pre-trade checklist
- The trend filter is on, and the market is above it.
- No scheduled event falls before the expected exit.
- The stop is set before entry, and the size follows from it.
- The time stop and the account's MTM limit are set.
- Margin is available with room to spare, including for a gap.
- The rules were backtested with costs and tested once on unseen data.
- The strategy has taken several trades in paper trading.
Start your free trial
Connect your broker, build a strategy and test it on paper before a single live order goes out.
Frequently asked questions
What is the best RSI setting for an RSI indicator strategy?
For swing mean reversion on daily candles, short periods such as 2 or 3 with entries below 5 to 15 are the most tested. For intraday signals on 5- or 15-minute candles, the traditional 14-period RSI with 30 and 70 is more common. Test the neighbouring settings on your instrument and choose one that is robust, not the single best.
Does RSI mean reversion work on Nifty?
It can, in some periods and with a trend filter, a stop and costs included. It struggles in long downtrends and around news. Backtest your exact rules over many years with costs, then paper trade them. We do not publish returns for any strategy, and nothing here is a performance claim.
What is the difference between RSI(2) and RSI(14)?
RSI(2) uses the last two periods and swings to extremes within a few sessions, which suits short swing trades. RSI(14) uses fourteen periods, moves more slowly and reaches extremes less often, which suits intraday signals and checking the trend.
What does an RSI above 70 mean?
The price has risen strongly over the RSI period. It is traditionally called overbought, but in a strong uptrend RSI can stay above 70 for a long time, so a high reading alone is not a reason to sell short.
Can I use RSI signals to trade options?
Yes, as a signal on the index. A bought call needs a quick bounce because of time decay; a bull call spread lowers the cost; a bull put spread earns if the market simply stops falling. Each needs its own exit and loss limit.
How often does the swing version trade?
On one index, RSI(2) below 10 above the 200-day average comes only a handful to a few dozen times a year, depending on the period. That is too few trades to judge on a short test, so test over many years and, where it makes sense, several instruments.
Is RSI mean reversion the same as RSI divergence?
No. Mean reversion trades extreme RSI readings. Divergence compares the swings in price with the swings in RSI, for example a lower low in price with a higher low in RSI. See the RSI divergence strategy.
Can I run an RSI strategy as an algo under SEBI's rules?
Yes, through a SEBI-registered broker under the retail algo framework that has applied in full since 1 April 2026. Follow the applicable broker and exchange requirements; this strategy example is not a claim of approval. The rules govern how orders are sent, not which indicators you may use.
Related guides and terms
- RSI indicator and RSI divergence strategy
- Bollinger band mean reversion strategy and VWAP indicator for option trading
- Swing trading strategy and momentum breakout strategy
- Moving averages and technical indicators
- Bull put spread strategy and bull call spread
- Position size calculator and brokerage calculator
- Glossary: MTM meaning, lot size meaning, delta meaning, theta meaning, what is margin in trading
Sources
- Wilder, J. W. (1978). New Concepts in Technical Trading Systems. Trend Research
- Connors, L. and Alvarez, C. (2009). Short Term Trading Strategies That Work. TradingMarkets Publishing
- Jegadeesh, N. (1990). Evidence of Predictable Behavior of Security Returns. Journal of Finance, 45(3), 881–898
- Lehmann, B. N. (1990). Fads, Martingales, and Market Efficiency. Quarterly Journal of Economics, 105(1), 1–28
- Finance Act, 2026: STT of 0.05% on the sale of futures and 0.15% on the sale of options from 1 April 2026
- NSE: Equity derivatives contract specifications (lot sizes and expiry days)
- SEBI circular on safer participation of retail investors in algorithmic trading, 4 Feb 2025, and the implementation timeline to 1 April 2026