
What you can do with multiple charts
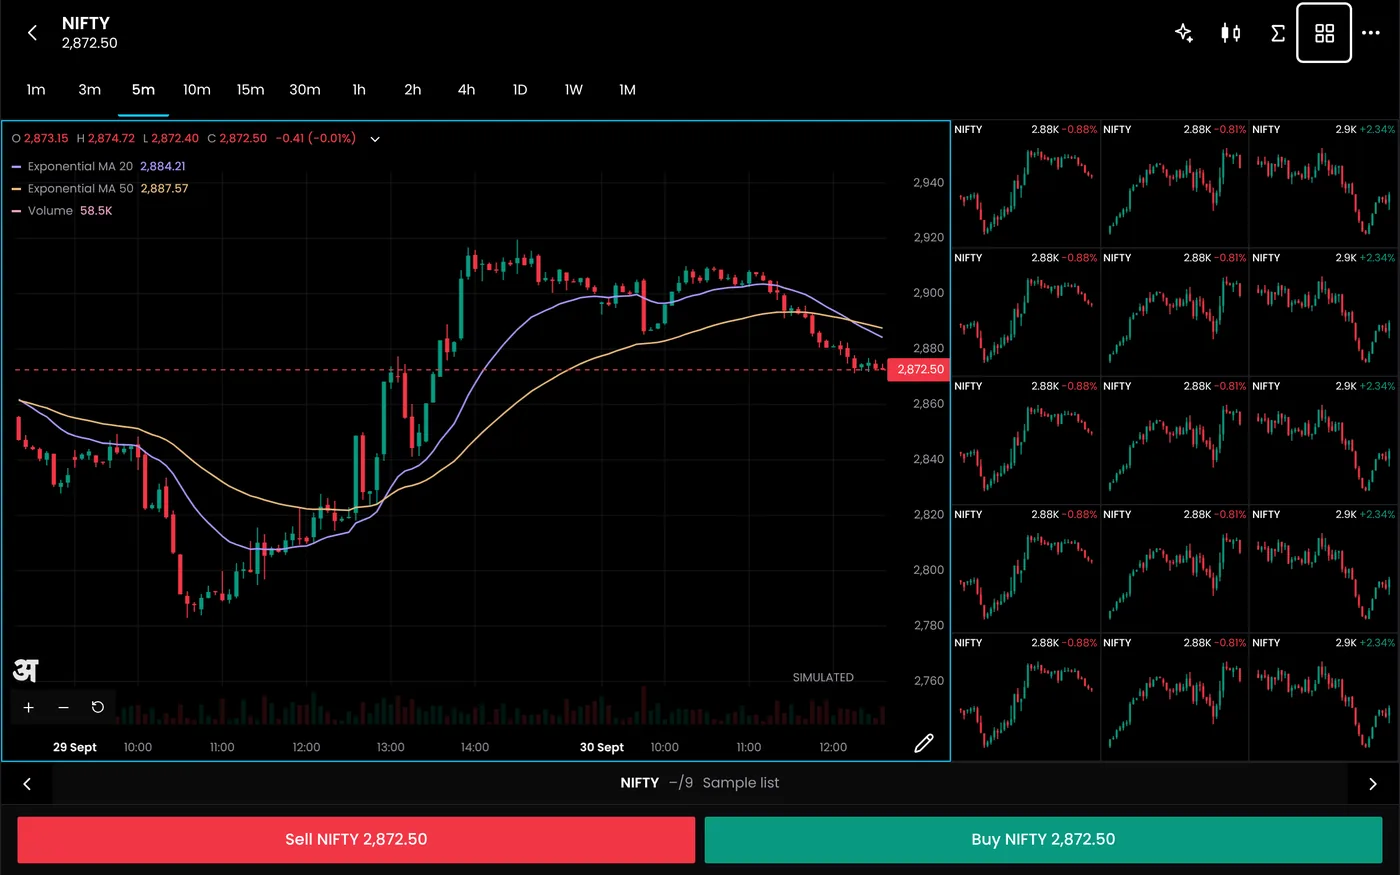
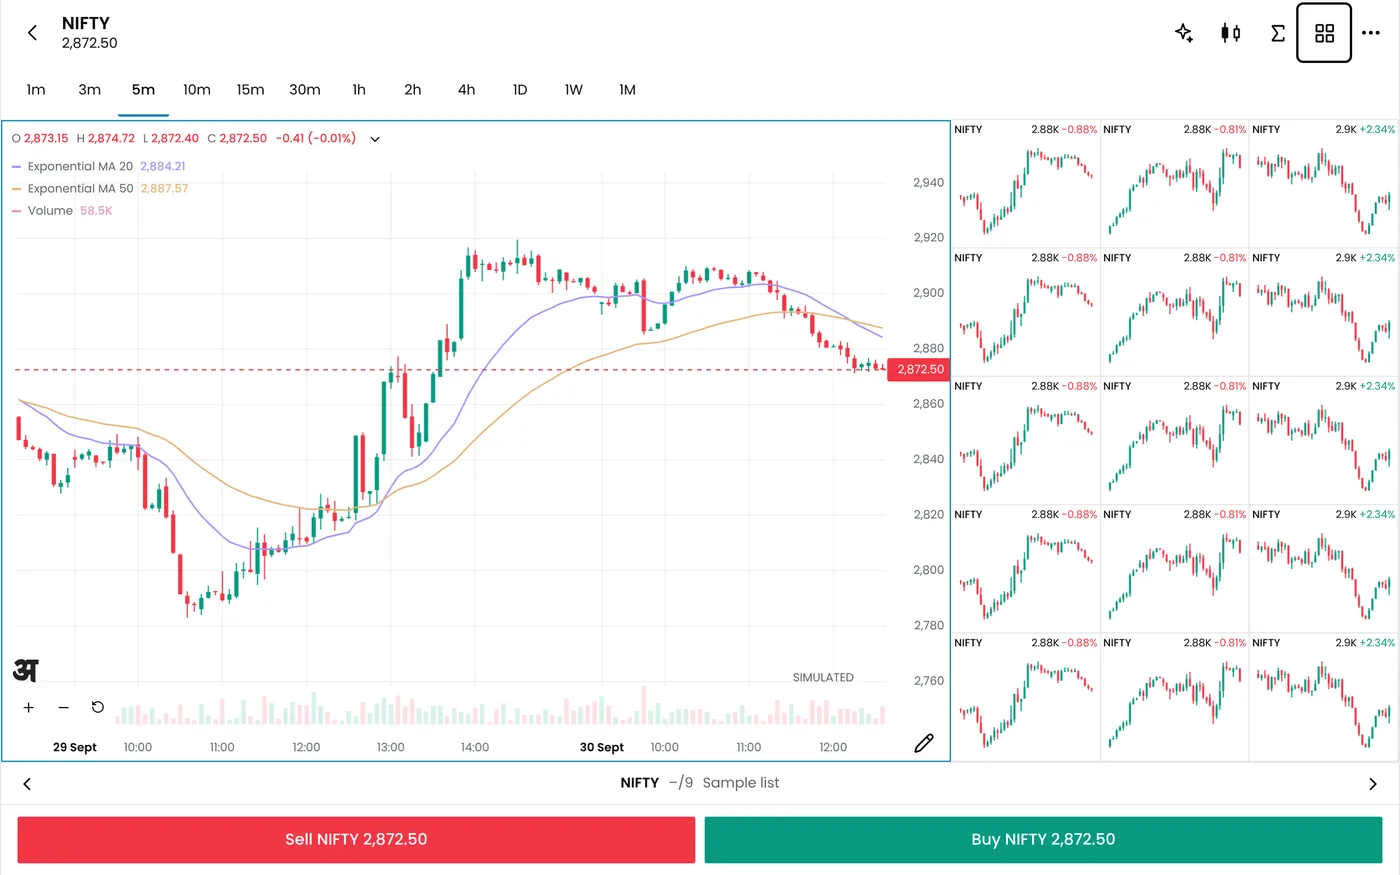
- Compare instruments. Watch an index next to its futures, its largest stocks or the options you trade.
- Compare timeframes. Keep the daily trend in view while you time entries on a 15-minute or 5-minute chart.
- Set each chart on its own. Every chart has its own instrument, timeframe and indicators, such as moving averages, VWAP, RSI or Supertrend.
- Choose a layout. Put up to 16 charts on one screen, each with its own instrument and timeframe, and save the layout you use most.
Charts and the chart library in QuantPower are provided by Arth.live. One broker connection feeds every chart on the screen, so adding a chart does not need another data plan.
Screen set-ups for different traders
A useful layout starts from the decisions you make during the day. These set-ups are starting points; swap in the instruments you actually trade.
| If you trade | Charts side by side | What to watch |
|---|---|---|
| Nifty options intraday | Nifty and Nifty futures on 5 minutes, the at-the-money call and the at-the-money put | Whether premiums follow the index or lag it |
| Bank Nifty | Bank Nifty on 5 minutes, and its largest stocks, such as HDFC Bank and ICICI Bank | Whether the big banks agree with the index move |
| Weekly option selling | Nifty on daily, hourly and 15-minute charts | Whether the index is ranging or trending towards your short strikes |
| Index futures | Nifty and Nifty futures on the same timeframe | The futures premium over the index, and whether it widens on a rally |
| Swing trades in stocks | The stock on weekly and daily charts, Nifty daily and the stock's sector index | Whether the stock, its sector and the market point the same way |
The tutorial on how to set up multiple charts walks through choosing a layout and setting each chart.
Combining timeframes
Traders who use several timeframes give each one a job. The higher timeframe sets the direction, the middle one shows the set-up, and the lower one times the entry. A common rule of thumb keeps each timeframe about four to six times the one below it, so the charts show different things rather than the same move at slightly different scales.
| Style | Direction | Set-up | Entry |
|---|---|---|---|
| Quick intraday trades | 30 minutes | 5 minutes | 1 minute |
| Intraday | Daily | Hourly | 15 minutes |
| Swing | Weekly | Daily | Hourly |
Our multi-timeframe strategy guide turns this idea into rules you can test.
Comparing instruments
Instruments placed side by side show what a single chart cannot:
- Index and futures. The gap between them is the futures premium. It shrinks towards expiry, and a premium that widens during a rally points to strong buying in futures.
- Index and heavyweights. If Nifty rises on two large stocks while most others are flat, the move is narrower than the index suggests.
- Option and underlying. If Nifty rises 50 points and the call you hold barely moves, implied volatility may be falling, or the strike may be far from the money.
- Two related stocks. Two private banks or two IT companies on the same timeframe show which one is leading and which is lagging.
Use the same timeframe and the same indicators on charts you compare, so that differences come from the market and not from the settings.
Keeping several charts readable
- One question per chart. If a chart never changes a decision, remove it.
- Two indicators per chart at most. More lines slow down the screen and the reader.
- Mark levels before the open. Draw the previous day's high and low, weekly levels and pivot levels on the higher timeframes, where they matter most.
- Let alerts do the waiting. Set market alerts at the levels you marked instead of watching every chart for them.
- Keep the same layout each day, so your eye knows where to look when the market moves fast.
Where the prices come from
Charts use live prices from your connected broker account, so the candles match the prices your broker sees. Zerodha users need Zerodha's Kite Connect plan, at ₹500 a month per app, for live data in QuantPower; Upstox and Fyers include market data free.
Outside market hours, charts show history and start updating again when the next session opens. A chart of an expired futures or option contract stops updating, so move it to the new contract after expiry.
From charts to orders
Multiple charts sit in the live trading terminal, next to the order ticket, the option chain and your positions. You can watch the charts while you place an order, follow an open position against the levels you marked, and step in by hand when a level breaks. If you find yourself placing the same order every time a chart shows the same condition, that rule can be backtested and automated with signal trading instead.
We are also building our own charting engine in India, QuantPower Charts. Join early access.
Plans
The QuantPower Standard plan is free during the Beta (₹299/month after); Professional is ₹499/month and Ultimate ₹999/month, GST extra. See pricing. Every plan starts with a free trial.
Related guides
- How to set up multiple charts: choosing a layout and setting each chart
- Live trading terminal: charts, the option chain, orders and positions on one screen
- Market alerts: notifications at the levels you mark
- Multi-timeframe strategy: rules that combine timeframes
- Signal trading: indicator rules and TradingView alerts turned into orders
Start your free trial
Connect your broker, build a strategy and test it on paper before a single live order goes out.
Frequently asked questions
Which charting software does QuantPower use?
QuantPower uses Arth.live charts: 100+ indicators, candle patterns, chart formations, drawing tools and bar replay. They run on live prices from your connected broker account.
Does each chart need its own data subscription?
No. Every chart uses the same broker connection. Zerodha users need one Kite Connect plan, at ₹500 a month per app, for live prices; Upstox and Fyers include market data free.
How many charts should I keep on one screen?
Four is a comfortable number on a laptop or desktop. Beyond that, each chart gets small and the screen gets slower, so add a chart only if it changes a decision.
Can I use multiple charts on my phone?
A phone screen suits one chart at a time. For several charts side by side, use a laptop or desktop.
Can I compare an index with its futures?
Yes. Put both on the same timeframe to see the futures premium, which usually narrows as expiry approaches.
Sources
- Arth.live: chart library used for QuantPower's charts (arth.live)
- QuantPower features and plans as listed on quantpower.tech (checked 20 October 2026)
- Zerodha Kite Connect: API pricing (checked 20 October 2026)
- Upstox and Fyers: API and market data pages (checked 10 October 2026)