
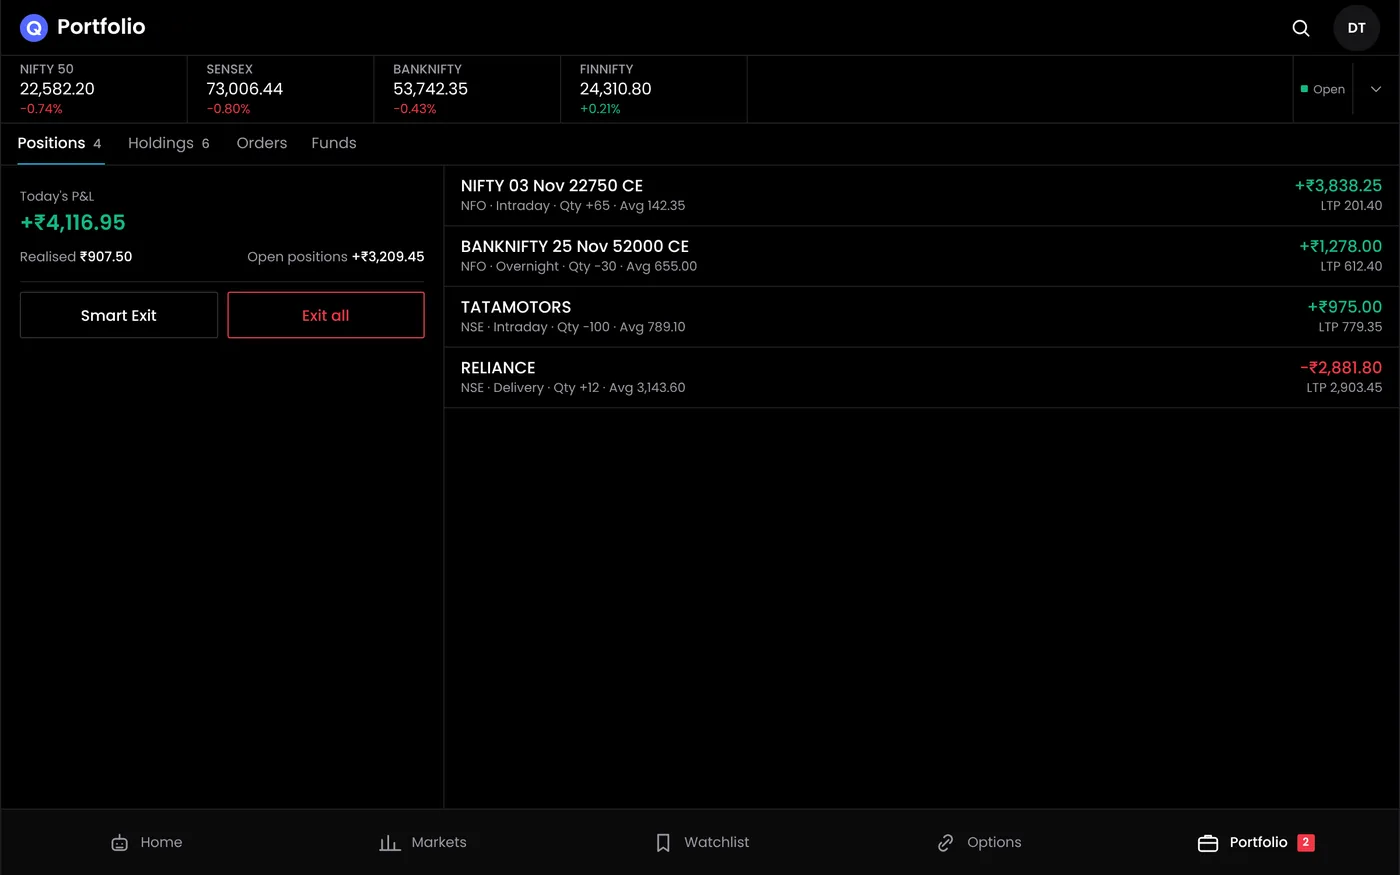
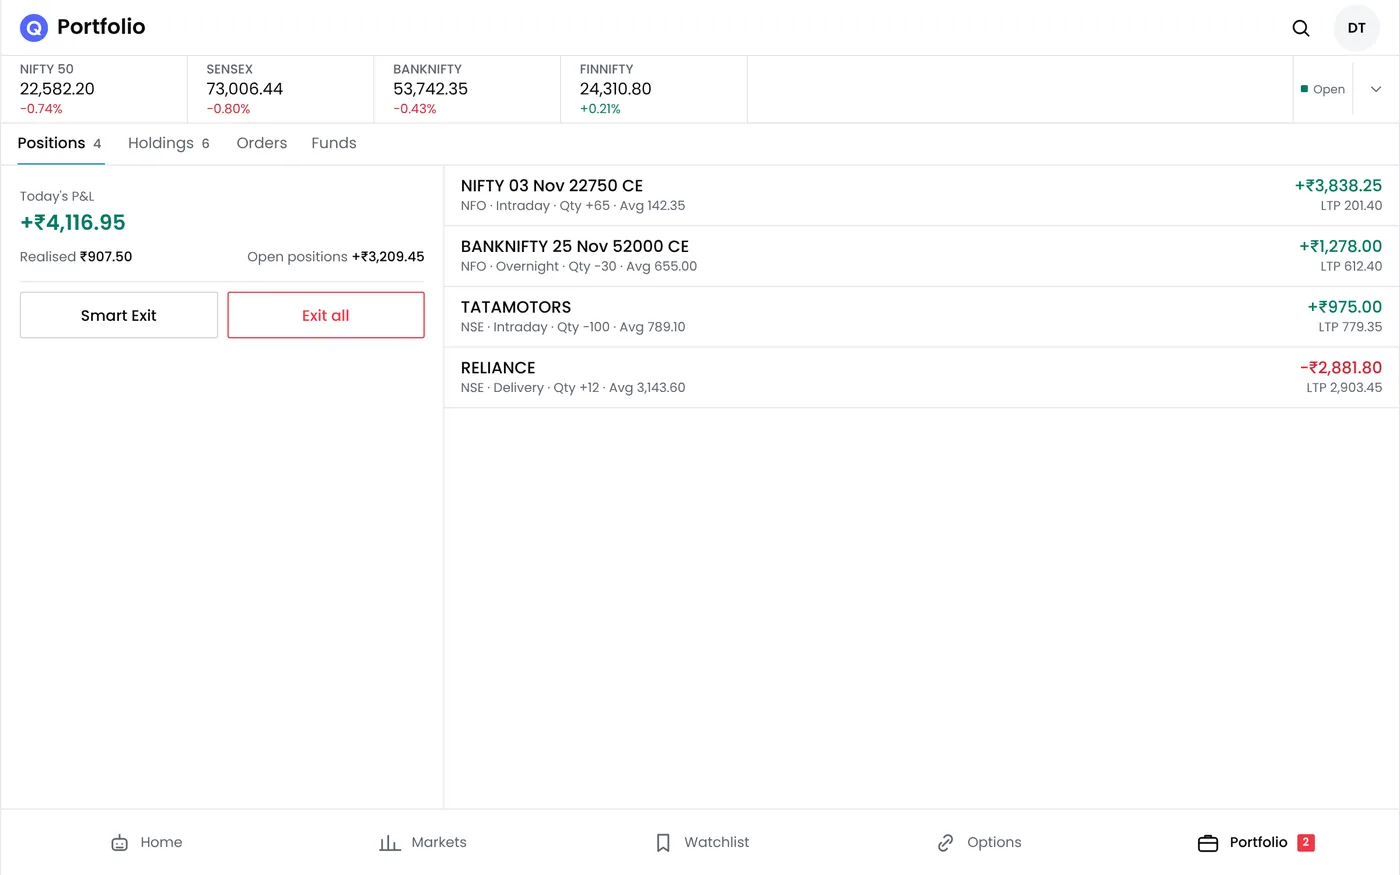
What position monitoring shows
- Each open position: the contract, quantity, product (intraday or carry forward), average price, last traded price and running P&L.
- The day's total: the combined P&L of all your open positions.
- By strategy: positions opened by your own algo bots, grouped under the strategy that opened them, with the strategy's combined P&L.
- Today's orders: each order behind your positions, with its time and status.
- Verified P&L: a record of the profit and loss from your trades, kept for review.
Positions are held by your broker. QuantPower reads them from your broker account and places orders for them, so the broker's records remain the final word on quantities and prices.
Reading live P&L
The P&L on an open position is marked at the last traded price. For a bought position it rises as the price rises; for a sold option it rises as the premium falls. It is not money in your account until you exit, and the exit happens at the best bid or ask, which can differ from the last trade, especially on strikes far from the money.
Multi-leg strategies need to be read as a whole. One leg showing a profit says little about the trade.
Adding up the legs that share a source gives the strategy's figure. Reading leg by leg can make a losing trade look half right.
Manual and automated positions in one view
Bots and manual trades use the same broker account, so their positions sit in one list. Your broker nets positions by contract, so a bot and a manual trade in the same contract show as one position; keep bots and manual trades on different contracts if you want to tell their results apart.
Each bot manages the positions it opened. If you exit or change one of them by hand, the bot may still act on it, for example by sending an exit for a leg you have already closed. Pause the bot first, then act. The tutorial on how to manage open positions walks through each button on the positions screen.
Verified P&L
Verified P&L is a record of the profit and loss on your trades, built from what actually traded in your broker account rather than from notes or memory. It is useful for an honest review of what your trading, manual and automated, actually made.
For tax and accounting, your broker's contract notes and tax P&L statement remain the official record.
Exiting positions
You can exit a single position, each leg of a strategy such as both legs of a straddle, or every open position at once with Exit all. Each exit is an order placed from QuantPower.
- An exit is an order. It can fill in parts or be rejected, so check the order book after every exit.
- Close short legs before their hedges. Exiting the bought leg first can leave a naked short option and raise the margin needed.
- Expect the bid or ask, not the last trade. In thin strikes the exit price can be worse than the P&L suggested.
- Cancel stops you no longer need. A pending stop on a closed position can trigger later and open a new one.
Limits that act on what you see
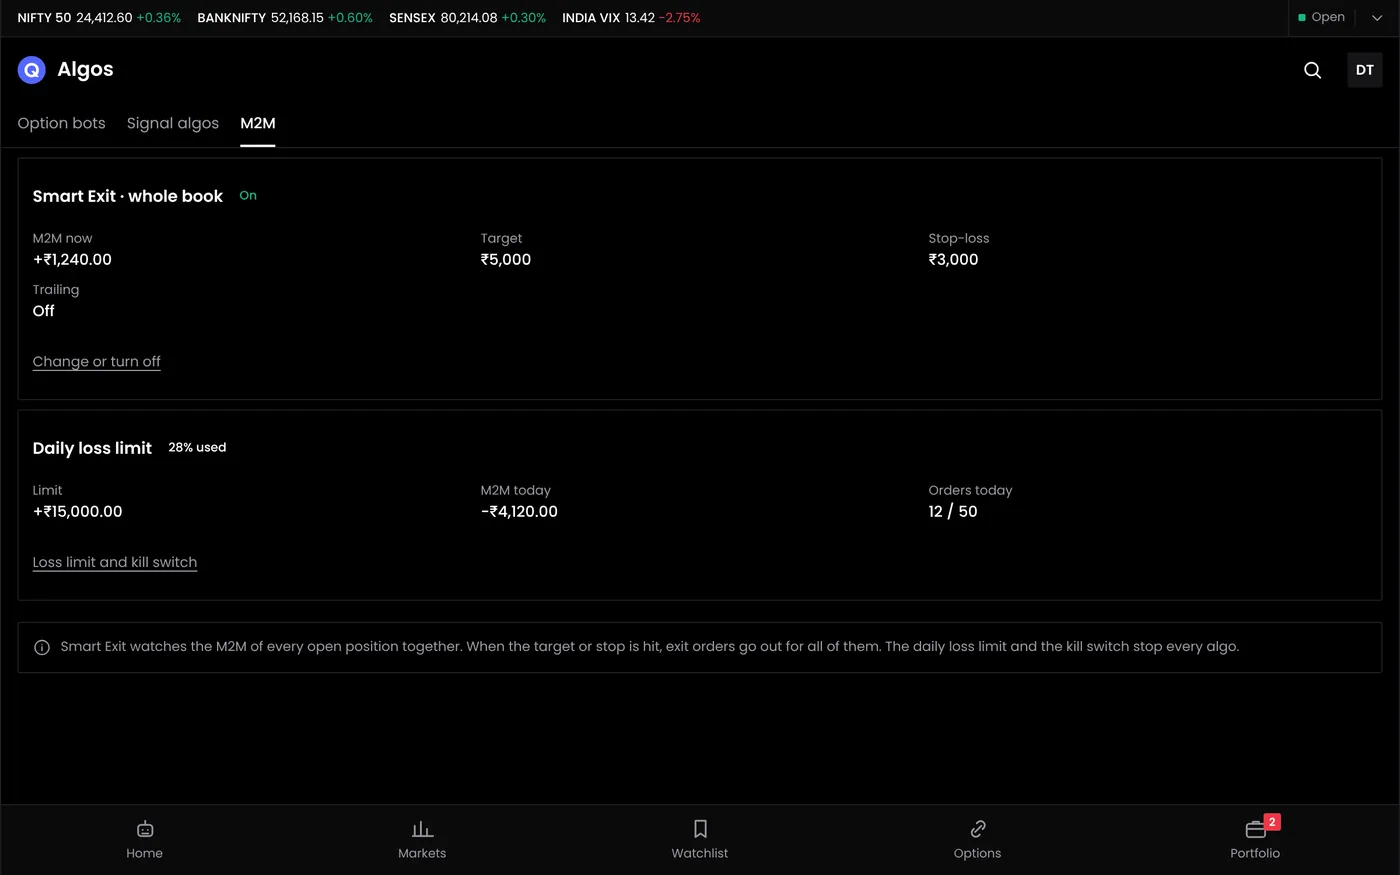
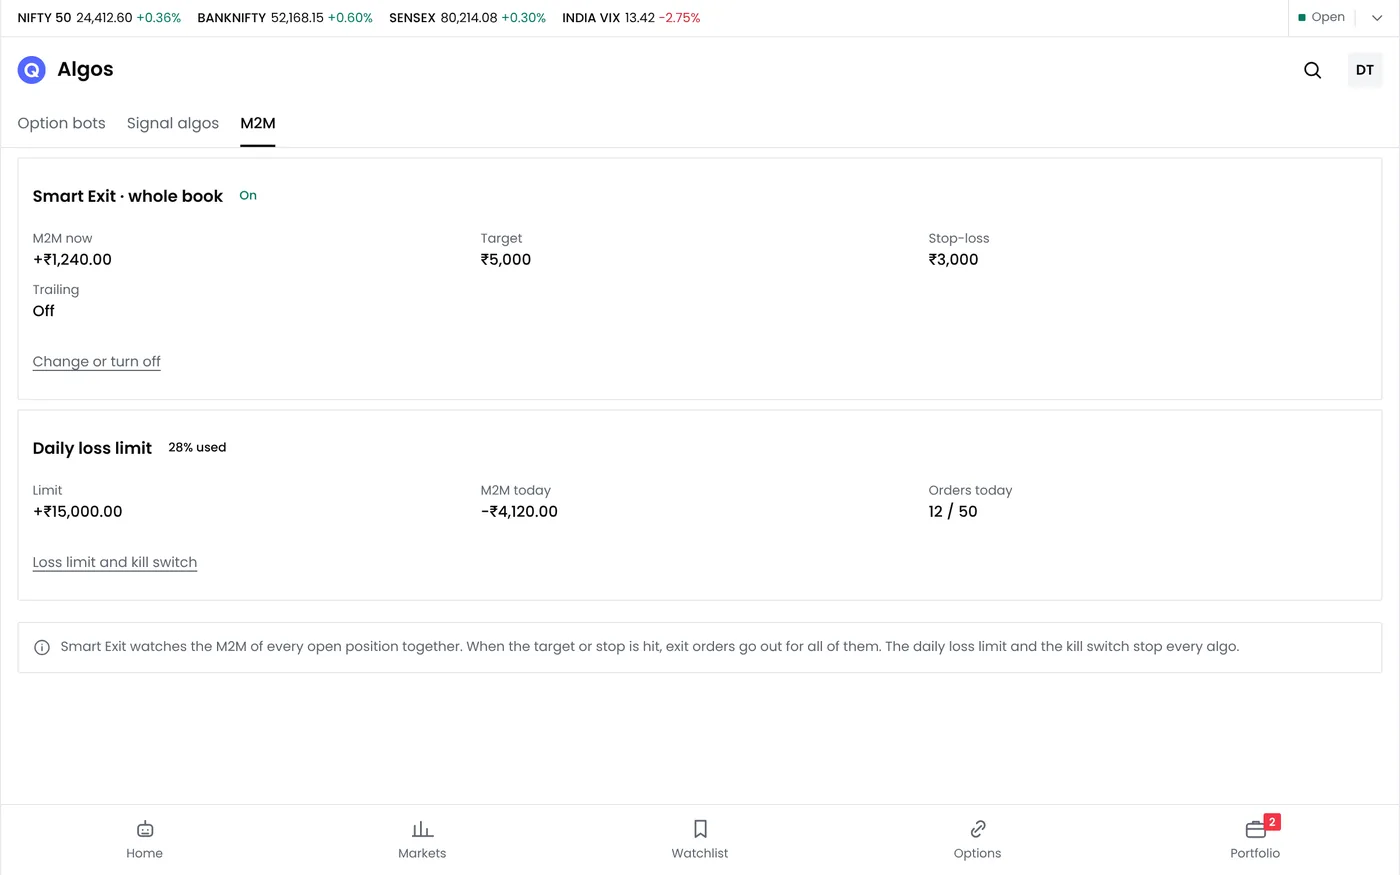
Watching a screen all day is not a risk control. Three tools act when you are not looking:
- The MTM stop loss squares off the covered positions when the day's combined loss reaches your limit.
- Stop-loss orders on each position, or inside each strategy, exit one position at its level.
- Market alerts tell you when a price reaches a level you care about.
Size positions so that the worst likely day stays inside the limit. The position size calculator works out lots from the loss you can accept. A gap or a rejected exit can still make the final loss larger than a limit.
On your phone
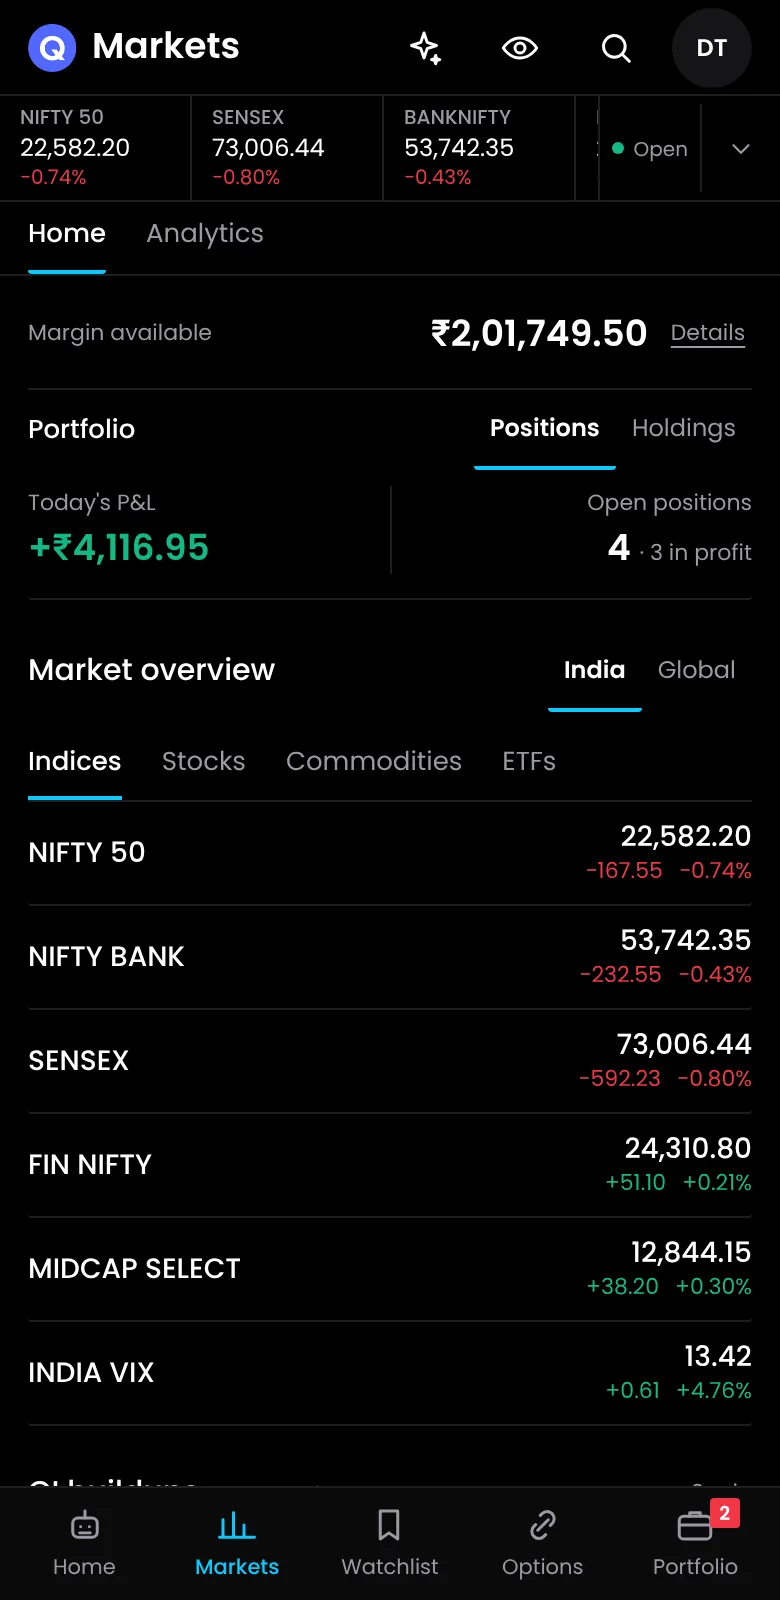
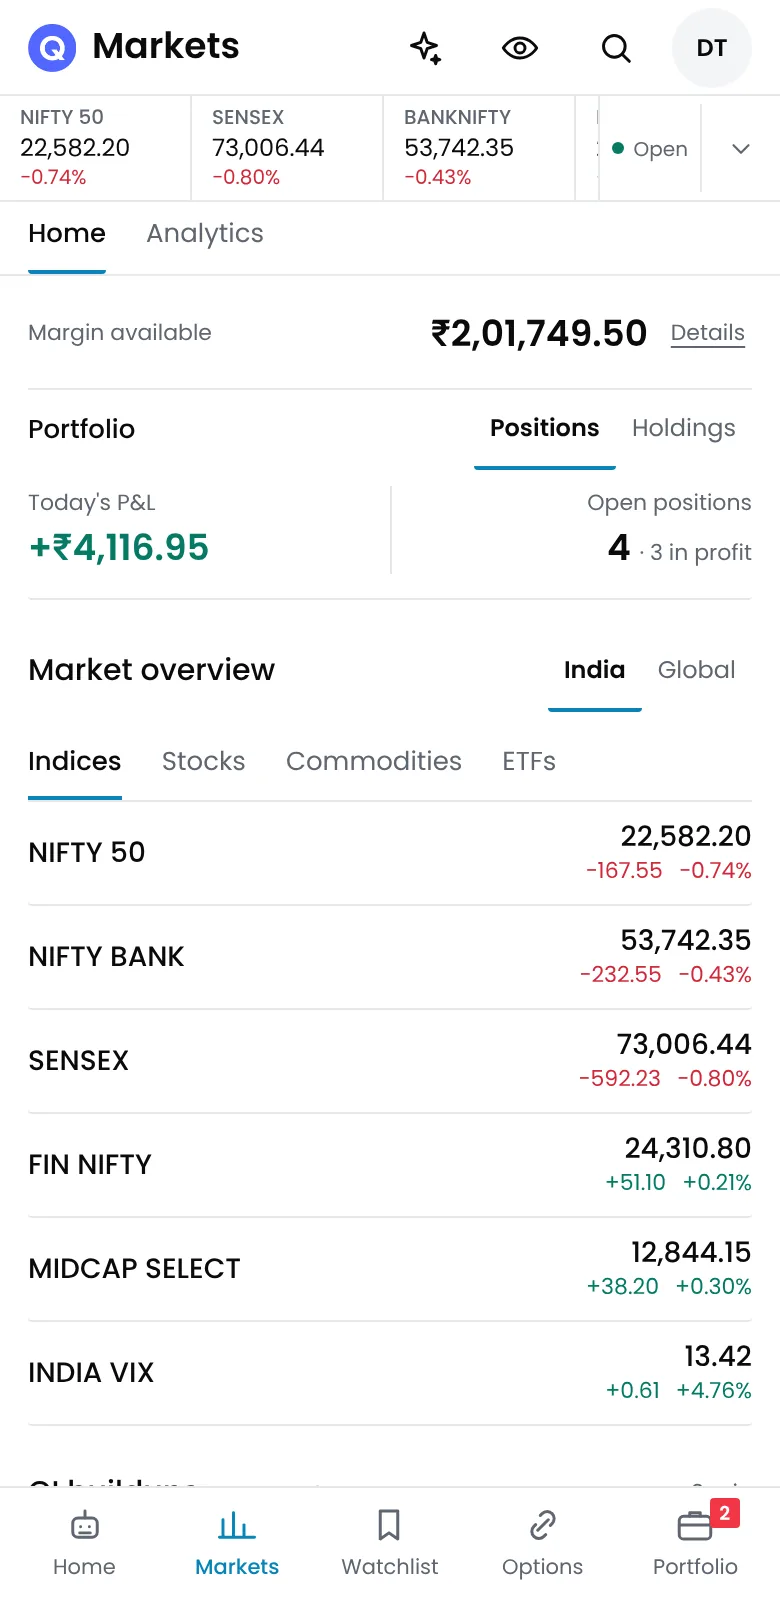
QuantPower's Android app, on Google Play, lets you follow your positions and the day's P&L away from your desk. On iPhone, use the web platform in Safari. The QuantPower Standard plan is free during the Beta (₹299/month after); Professional is ₹499/month and Ultimate ₹999/month, GST extra. See pricing.
A monitoring routine
- Before the open: check carried positions, free margin and today's broker login.
- After each entry: confirm every leg filled at the expected quantity.
- During the session: watch the combined P&L against your limit, not single legs.
- Before the close: confirm intraday positions closed and no stray stop orders remain.
- After the close: compare quantities with your broker's app; they should match exactly.
Plans
The Standard plan is free during the Beta; see pricing for each plan's daily allowances.
Related guides
- How to manage open positions: the positions screen, step by step
- How to place stop loss order: per-trade stops and the daily MTM limit
- Position size calculator: lots that fit the loss you can accept
- Order management: the orders behind every position
- Market alerts: alerts on levels you do not want to watch all day
Start your free trial
Connect your broker, build a strategy and test it on paper before a single live order goes out.
Frequently asked questions
Why does my P&L differ from my broker's app?
Prices update at slightly different moments, and some brokers measure the day's P&L on carried positions from the previous close rather than your entry price. Quantities should match exactly; small P&L gaps from timing are normal.
Why can an option's P&L look better than the price I get on exit?
P&L is marked at the last traded price, but you exit at the best bid or ask. On thin strikes the last trade can be minutes old and the spread wide, so the exit can be worse than the screen suggests.
Can I close a bot's position myself?
Yes, but pause the bot first. Otherwise it may try to manage a position that no longer exists, such as sending an exit for a leg you have already closed.
Can I use verified P&L for my tax return?
Use your broker's contract notes and tax P&L statement for filing. Verified P&L is for reviewing your trading, not a tax document.
What should I check first if a position looks wrong?
The order book. A partly filled, rejected or cancelled order is the usual cause. Then compare quantities with your broker's app, because the broker holds the positions.
Sources
- NSE: revision in market lot of index derivative contracts from the January 2026 series (nseindia.com) (checked 20 October 2026)
- QuantPower plans and features as listed on quantpower.tech (checked 20 October 2026)